JMX Monitoring
Customers who create custom Java code or complex light module structures can benefit from a new set of MBeans exposed in Magnolia DX Core 6.4. In particular, you can inspect running Java processes using JMX technology. If you know your way around JCR well, inspecting those processes and having statistics available can help provide valuable insights, such as session leaks or slow and frequently executed queries.
You can use JMX technology out-of-the-box to manage Java Virtual Machines. Specifically, you can attach a JMX client to a Java process to access the built-in Java VM instrumentation to monitor and manage a JVM remotely. JDK Mission Control is one possibility; Prometheus or Datadog are further options, each with different visualization and customization alternatives. See JMX Monitoring for more information about monitoring on a DX Cloud setup.
MBeans
JMX is for managing and monitoring applications and system objects. Objects are represented as management beans (MBean). JMX is supported by many Java application servers such as Apache Tomcat, JBoss AS and IBM WebSphere. The following subsections introduce MBeans available in Magnolia DX Core 6.4 to help you optimize potential issues in your custom code.
PublishingMonitor
The PublishingMonitor MBean exposes select publishing metrics.
-
Open JConsole in the terminal.
-
Connect to the Tomcat process (
org.apache.catalina.startup.Bootstrap). -
Go to the MBeans tab.
-
Expand Magnolia > PublishingMonitor > magnoliaAuthor > Attributes.
You must publish some content first; otherwise, PublishingMonitor won’t appear in the tab.
|

RepositoryStats
The RepositoryStats MBean exposes the following metrics about the JCR repository. See info.magnolia.repository.mxbean.RepositoryStatsMBean in our Javadocs for details.

These metrics help answer the following kinds of questions.
-
How many times did the instance read from the JCR repository?
-
How many JCR sessions did the instance open?
-
How long do queries take, and how often are they sent?
If session counts increase at unexpected levels, a session leak in your code could need to be investigated. Increased reading and writing times to the JCR could also be helpful information to understand, for example, instance sizing issues better.
QueryStat
The QueryStat MBean exposes the following metrics about JCR queries.
See org.apache.jackrabbit.api.jmx.QueryStatManagerMBean in Apache Jackrabbit QueryStatManagerMBean Javadoc for details.


You might need to look at queries happening too slowly and frequently more closely. In particular, if you’re investigating the slowness of JCR queries, the query leaderboards help you rank queries and drill down into the details.

EventListenerMBean
The EventListenerMBean MBean exposes the following metrics about JCR observation.
Observation listeners on the config workspace don’t expose this MBean.
See org.apache.jackrabbit.api.jmx.EventListenerMBean in Apache Jackrabbit EventListenerMBean Javadoc for full details.

Observation listeners receive callbacks when certain events happen, such as when a new node is created in the website workspace.
Each row (magnolia-test-public-webapp-6.4…) on the left of the example above represents one callback.
WorkspaceStats
The WorkspaceStats MBean exposes the following metrics about the JCR repository.
See info.magnolia.repository.mxbean.WorkspaceStatsMBean in our Javadocs for details.
The WorkspaceStats MBean reports an approximate number of items for a given node type in a workspace.
It is exposed for all workspaces.

The number of items is estimated by sampling a certain number of randomly chosen paths.
For each sample, the total number of items is extrapolated recursively by multiplying the number of children of the root node by the estimated number of items of one randomly chosen child and adding one for the root.
This process is repeated to establish a moving average with the specified sample size (getSampleSize()).
The moving average extends over the specified window size (getWindowSize()).
When the window size is smaller than the sample size, the number of samples placed into each window slot is the arithmetic mean of sample size/window size.
Larger sample sizes give better estimates, while smaller window sizes cause more samples to be taken per call to getNodeCountApproximation(), placing more load on the server.
For more information, see Estimating the Efficiency of Backtrack Programs
You can optionally register an implementation of info.magnolia.repository.mxbean.WorkspaceStatsConfigurer with Java’s service loader mechanism for individual workspaces.
If no such implementation is registered, the MBean will still be there with its default configuration.
The Pages app and the Assets app use this mechanism to set the node type to mgnl:page and mgnl:asset, respectively (see PAGES-1581 and MGNLDAM-1407).


SiteStats
The SiteStats MBean exposes the following metrics about the JCR repository.
See info.magnolia.module.site.SiteStatsMBean in our Javadocs for details.
The SiteStats MBean exposes the number of sites reported by the SiteManager.

JConsole
Java Monitoring and Management Console (JConsole) is a graphical tool that supports JMX monitoring and management on a local or remote machine. It draws graphs for visual representation of performance and resource consumption, which makes it easier to observe changes over time. As a downside, the results are not as easy to export as withJmxterm.
Starting JConsole
-
Start JConsole:
$ jconsole -
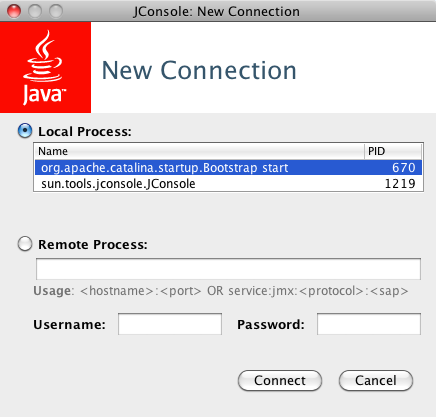
Connect to a process:
-
Local: Select a Java process running on the local machine. Magnolia running on Tomcat would be listed as
org.apache.catalina.startup.Boostrap start. -
Remote: Type a remote process location as
<hostname>:<port>orservice:jmx:<protocol>:<sap>.
-
-
Click Connect
See Using JConsole for instructions on how to view and interpret the charts.
Saving Chart Data
To save data from a JConsole chart in CSV format:
-
Right-click the chart and select Save data as…
-
Specify a file to save.
The CSV file can be imported into a spreadsheet to re-create the chart.
Example: Flushing the cache in JConsole
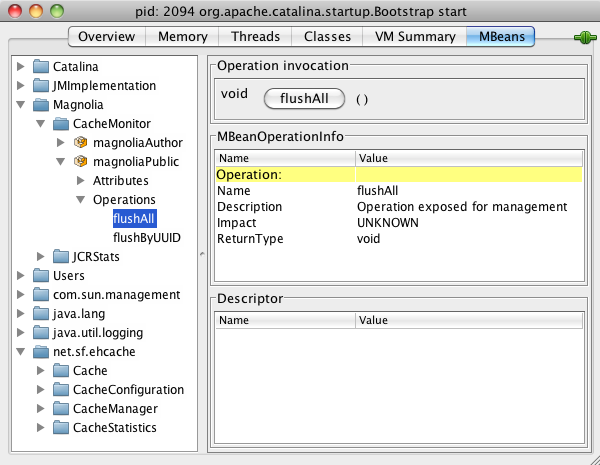
JMX is not only used to observe events. You can also invoke operations. In this example the server cache is flushed on the public instance using JConsole:
-
Open JConsole and connect to the Magnolia process.
-
Go to the MBeans tab.
-
Expand Magnolia > Cachemonitor > magnoliaPublic > Operations. This is a list of invokable operations provided by the CacheMonitor MBean.
-
Click flushAll to invoke the flush operation.
Jmxterm
Jmxterm is a command line JMX tool. Unlike JConsole, it does not have a graphical user interface. However, its big advantage is that Magnolia Support can give you a script that you can paste into your Jmxterm and run it. You can also write the Jmxterm output to a file and attach it to a support ticket. This makes it easier to collect and analyze specific data. Jmxterm is good for point-in-time observation whereas JConsole is better for visualizing events over a longer period.
Example: Flushing the cache in Jmxterm
Start Jmxterm.
$ java -jar jmxterm.jar
Welcome to JMX terminal. Type "help" for available commands.
The jvms command tells you what Java processes are running on the machine.
$>jvms
5622 ( ) - jmxterm.jar
4623 ( ) - sun.tools.jconsole.JConsole
2094 (m) - org.apache.catalina.startup.Bootstrap start
Open the connection to the Catalina JVM using the process ID.
$>open 2094
#Connection to 2094 is opened
The domains command lists the domains available in the Java process.
$>domains
#following domains are available
Catalina
JMImplementation
Magnolia
Users
com.sun.management
java.lang
java.util.logging
net.sf.ehcache
Set the domain to Magnolia.
$>domain Magnolia
#domain is set to Magnolia
The beans command provides a list of MBeans in the domain.
Here are the beans in the Magnolia domain.
$>beans
#domain = Magnolia:
Magnolia:domain=magnoliaAuthor,type=CacheMonitor
Magnolia:domain=magnoliaAuthor,type=JCRStats
Magnolia:domain=magnoliaPublic,type=CacheMonitor
Magnolia:domain=magnoliaPublic,type=JCRStats
We need the CacheMonitor bean for the public instance.
$>bean Magnolia:domain=magnoliaPublic,type=CacheMonitor
#bean is set to Magnolia:domain=magnoliaPublic,type=CacheMonitor
info tells you what a bean does.
The CacheMonitor bean provides several attributes and operations.
$>info
#mbean = Magnolia:domain=magnoliaPublic,type=CacheMonitor
#class name = info.magnolia.module.cache.mbean.CacheMonitor
\# attributes
  %0   - All (java.util.Map, r)
  %1   - Bypasses (int, r)
  %2   - CachedKeysCount (int, r)
  %3   - CachedUUIDsCount (int, r)
  %4   - DomainAccesses (java.util.Map, r)
  %5   - Flushes (java.util.Map, r)
  %6   - Hits (int, r)
  %7   - Puts (int, r)
  %8   - StartCalls (int, r)
  %9   - StopCalls (int, r)
\# operations
  %0   - void flushAll()
  %1   - void flushByUUID(java.lang.String p1,java.lang.String p2)
#there's no notifications
Invoke the flushAll operation to flush the cache.
$>run flushAll
#calling operation flushAll of mbean Magnolia:domain=magnoliaPublic,type=CacheMonitor
#operation returns:
null
Let’s see how many times the cache has been flushed by checking the Flushes attribute with the get command.
This particular operation does not return any value, just null.
$>get Flushes
#mbean = Magnolia:domain=magnoliaPublic,type=CacheMonitor:
Flushes = {
  uuid-key-mapping = 3;
  default = 3;
 };
Three times, it seems.
Example: Running a Jmxterm script
Jmxterm can read a script file with the -i <input script> command line option.
Save the following script as script.txt:
open <JVM process ID>
get -d Magnolia -b Magnolia:domain=magnoliaPublic,type=JCRStats SessionCount
get -d Magnolia -b Magnolia:domain=magnoliaPublic,type=CacheMonitor All
quit
Replace <JVM process ID> with the ID of the Java Virtual Machine that is executing the Magnolia application.
You can find it with ps | grep jvm.
Execute the script with:
$ java -jar jmxterm.jar -n -i script.txt -o output.txtwhere
-
-nsets Jmxterm to non-interactive mode. -
-i <input script>reads the script. -
-o <output file>writes the output to a file.
You should get results like this in the output file:
SessionCount = 12;
CachedUUIDsCount = 7;