Monitoring
Monitoring is a process that detects, diagnoses, remedies and reports an application’s performance and availability to ensure that it meets user expectations. Magnolia provides built-in tools for logging and debugging application behavior. It also supports Java Management Extensions (JMX), a Java technology for managing and monitoring. These mechanisms provide developers, administrators and especially the support team detailed context for application failures.
Log4j 2
Magnolia uses Apache Log4j 2, a Java-based logging utility. It logs events in Magnolia core code as well as any modules that support logging. Logging is configured in three places:
| Type | Location | Description |
|---|---|---|
|
|
A permanent configuration which persists restarts. In the XML file you can also choose whether you wish to log a Class or package. Any changes made to the file will require a restart of the server. |
Log Tools app |
Tools menu |
A transient configuration which resets after a restart. In the Log Tools app you can choose whether you wish to log a Class or package. Any changes made in the app are active immediately. This tool is useful for ad-hoc debugging of production issues since you don’t need to restart Magnolia to turn it on. |
Audit Logging |
|
Audit logging means tracking user activity in the system such as who signed in and what they did. Here you select the actions you want to audit such as login, create, publish and so on. |
Debugging your configuration
It is possible to debug the log4j 2 configuration itself. Add the status
attribute to the Configuration element of the log4j2.xml configuration
file.
<?xml version="1.0" encoding="UTF-8"?>
<Configuration status="debug">
...
...
For more information on this topic see Log4j 2 Status Messages.
Loggers
Loggers define what data is logged and how much detail is provided. Think of this as a configuration for the classes and packages you want to log.
Here’s an example from the default log4j2.xml.
<!-- Publishing - additivity is true so logs also go to sub-categories' appenders -->
<Logger name="info.magnolia.publishing" level="INFO" additivity="true">
    <AppenderRef ref="log-publishing"/>
</Logger>|
Apps configured in the new App Launcher layout will cause entries to appear in the log. To keep the log tidy, we recommend adjusting your App Launcher layout configuration and removing any apps you don’t use. |
Class or package
The choice between logging a single class or the whole package depends
on whether the issue is limited to a single class. In the example above
we log everything within the package info.magnolia.publishing.
To summarize:
-
To log a specific class, use the fully-qualified class name as the category name.
-
To log a whole package, use the fully-qualified package name as the category name.
Level
Magnolia uses the standard log4j logging levels.
| Level | Description |
|---|---|
OFF |
The highest possible rank and is intended to turn off logging. |
FATAL |
Severe errors that cause premature termination. Visible in console. |
ERROR |
Other runtime errors or unexpected conditions. Visible in console. |
WARN |
Use of deprecated APIs, poor use of API, |
INFO |
Interesting runtime events (startup/shutdown). Visible in console, so be conservative and keep to a minimum. |
DEBUG |
Detailed information on the flow through the system. Written to logs only. |
TRACE |
More detailed information. Written to logs only. |
Pattern Layout
Log4j2’s Pattern Layout is a customizable log message formatter that uses conversion patterns to generate structured log outputs.
The log message is encoded to address CWE 117 (Improper Output Neutralization for Logs), ensuring user-supplied data is properly sanitized so as to prevent log injection attacks.
WEBAPP/src/main/webapp/WEB-INF/config/default/log4j2.xml<PatternLayout pattern="%d %-5p %-50.50c: %encode{%m}{CRLF}%n"/> (1)| 1 | Where the pattern matches:
|
|
In Magnolia CMS
|
Appenders
Appenders define where the output is directed. The following appenders
are configured by default in log4j2.xml. They write messages to the
console and to various log files.
| Appender | Writes to | Notes |
|---|---|---|
|
Console |
Default output for DEBUG messages |
|
|
Default output for DEBUG messages. |
|
|
Default output for ERROR messages. |
|
|
Content publishing. |
|
|
Bootstrap process. |
|
|
System access. |
|
|
See Audit. |
|
|
See Logging form data. |
|
Sends mail. |
Disabled by default. |
Example: The log-publication appender is used to log events related to
content publishing.
<RollingFile name="sync-log-publishing"
             fileName="${magnolia.logs.dir}/magnolia-publishing.log"
             filePattern="${magnolia.logs.dir}/magnolia-publishing-%i.log"
             append="true">
  <PatternLayout pattern="%-5p %c %d{dd.MM.yyyy HH:mm:ss} -- %encode{%m}{CRLF}%n"/>
  <ThresholdFilter level="ERROR"/>
  <Policies>
    <SizeBasedTriggeringPolicy size="1MB"/>
  </Policies>
  <DefaultRolloverStrategy max="5"/>
</RollingFile>
<Async name="log-publishing">
  <AppenderRef ref="sync-log-publishing"/>
</Async>
It is actually two appenders: log-publishing appender uses the Async
class to queue up the messages while the referenced
sync-log-publishing appender does the actually writing of the messages
to the magnolia-publishing.log file.
All appenders that write to a log file use the RollingFile class.
Rolling means that the system takes a backup of the log file when its
size reaches a limit set in the SizeBasedTriggeringPolicy
(1 MB by default). The old file is date-stamped and a new file is started in the same directory.
Example: Debugging content publication
This example shows how to log more detail about content publication. It is useful when publication fails and the default INFO messages do not provide enough information to pinpoint the root cause.
Add the Logger to log4j2.xml if not already there:
<!-- Publishing - additivity is true so logs also go to sub-categories' appenders -->
<Logger name="info.magnolia.publishing" level="INFO" additivity="true">
    <AppenderRef ref="log-publishing"/>
</Logger>
Each category references the log-publishing appender which sends
output to the magnolia-publication.log file. Since additivity is
true, output is also sent to ancestor appenders, in this case the
console.
Priority is set at INFO level by default. If more information is needed, this is the detail that needs to be changed.
To change the level to DEBUG:
-
Stop the Magnolia instance.
-
Change
priorityin the three categories to DEBUG. -
Save the file.
-
Start Magnolia.
To test the new configuration, publish some content and view the logged
DEBUG messages in the magnolia-publication.log.
Note that by default there is a temp folder called tmp configured in
magnolia.properties in the actual webapp. This folder contains various
exchange_*.xml.gz files that are stored when debugging is enabled for
publication. The location of the files is specified by the
magnolia.upload.tmpdir.
Log Tools app
It is also possible to adjust the log4j settings from inside a running instance. This is a transient configuration which resets after a restart. From the Log Tools app you can choose whether you wish to log a Class or package. Any changes made in the app are active immediately. This tool is useful for ad-hoc debugging of production issues since you don’t need to restart Magnolia to turn it on.
Capturing request and response headers
Request and response headers are information passed between a browser and a web server. Headers consist of fields that define the operating parameters of the HTTP transaction. Capturing the headers tells you what records are passed and provides a clue for troubleshooting.
The request header contains details of what the browser wants and what it will accept back from the server. It also contains the type, version and capabilities of the browser so that the server returns compatible data.
Example: Request header
User-Agent: Mozilla/5.0 (Macintosh; Intel Mac OS X 10_6_8) AppleWebKit/534.50 (KHTML, like Gecko) Version/5.1 Safari/534.50
Accept: text/html,application/xhtml-xml,application/xml;q=0.9,*/*;q=0.8
Referer: http://demopublic.magnolia-cms.com/demo-project.html
Cache-Control: max-age=0
The response header contains the date, size and type of file that the server is sending back to the client and data about the server itself. The header is attached to the files being sent back to the client.
Example: Response header
Date: Thu, 13 Oct 2011 11:09:41 GMT
Content-Encoding: gzip
Connection: Keep-Alive
Content-Length: 3229
Pragma: no-cache
X-Magnolia-Registration: Registered
Last-Modified: Thu, 13 Oct 2011 11:01:26 GMT
Server: Apache/2.2.14 (Ubuntu)
Vary: Accept-Encoding
Content-Type: text/html;charset=UTF-8
Cache-Control: no-cache, no-store, must-revalidate, max-age=0
Keep-Alive: timeout=15, max=100
Expires: Thu, 01 Jan 1970 00:00:00 GMT
Browser extensions
To capture the headers, you can use a browser extension or plugin that displays headers for the currently open page. A plugin’s advantage over a Websites is that you can also use it for sites that only exist in your local environment or intranet.
-
Safari: Developer Tools
-
Firefox: Web Developer or Live HTTP Headers add-on
-
Chrome: Developer Tools
-
Internet Explorer: Fiddler
To view headers in Developer Tools:
-
Open Developer Tools.
-
Go to Network.
-
Reload the page.
-
Select the page in the list.
-
Go to Headers tab.
JMX monitoring
You can observe Java Virtual Machine and application server performance through Java Management Extensions (JMX). JMX is Java technology used for managing and monitoring applications and system objects. Objects are represented as management beans (MBean). JMX is supported by many Java application servers such as Apache Tomcat, JBoss AS and IBM WebSphere.
JConsole
Java Monitoring and Management Console (JConsole) is a graphical tool that supports JMX monitoring and management on a local or remote machine. It draws graphs for visual representation of performance and resource consumption, which makes it easier to observe changes over time. As a downside, the results are not as easy to export as with Jmxterm.
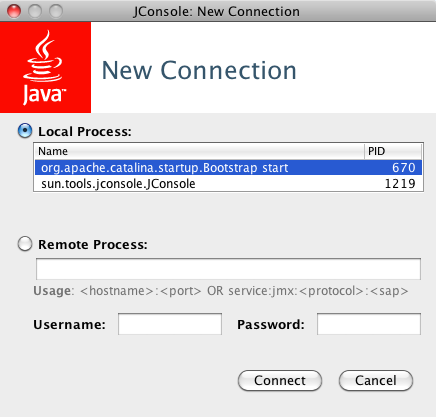
Starting JConsole
-
Start JConsole:
$ jconsole -
Connect to a process:
-
Local: Select a Java process running on the local machine. Magnolia running on Tomcat would be listed as
org.apache.catalina.startup.Boostrap start. -
Remote: Type a remote process location as
<hostname>:<port>orservice:jmx:<protocol>:<sap>.
-
-
Click Connect
See Using JConsole for instructions on how to view and interpret the charts.
Saving Chart Data
To save data from a JConsole chart in CSV format:
-
Right-click the chart and select Save data as…
-
Specify a file to save.
The CSV file can be imported into a spreadsheet to re-create the chart.
Example: Observing publishing statistics
Publishing exposes select publishing metrics through the PublishingMonitor MBean.
-
Open JConsole in the terminal.
-
Connect to the Tomcat process (
org.apache.catalina.startup.Bootstrap). -
Go to the MBeans tab.
-
Expand Magnolia > PublishingMonitor > magnoliaAuthor > Attributes.
You must publish some content first; otherwise, PublishingMonitor won’t appear in the tab.
|

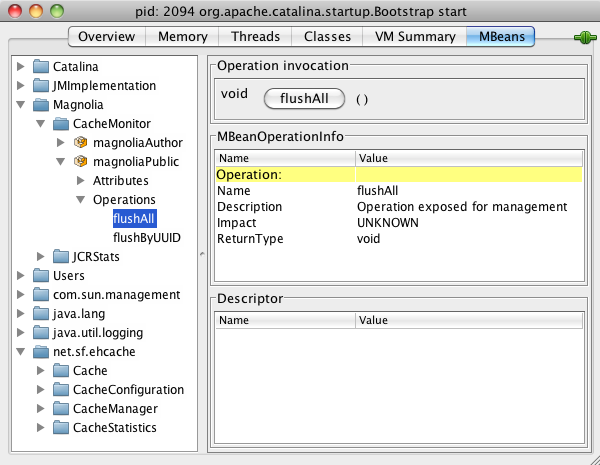
Example: Flushing the cache in JConsole
JMX is not only used to observe events. You can also invoke operations. In this example the server cache is flushed on the public instance using JConsole:
-
Open JConsole and connect to the Magnolia process.
-
Go to the MBeans tab.
-
Expand Magnolia > Cachemonitor > magnoliaPublic > Operations. This is a list of invokable operations provided by the CacheMonitor MBean.
-
Click flushAll to invoke the flush operation.
Jmxterm
Jmxterm is a command line JMX tool. Unlike JConsole, it does not have a graphical user interface. However, its big advantage is that Magnolia Support can give you a script that you can paste into your Jmxterm and run it. You can also write the Jmxterm output to a file and attach it to a support ticket. This makes it easier to collect and analyze specific data. Jmxterm is good for point-in-time observation whereas JConsole is better for visualizing events over a longer period.
Example: Flushing the cache in Jmxterm
Start Jmxterm.
$ java -jar jmxterm.jar
Welcome to JMX terminal. Type "help" for available commands.
The jvms command tells you what Java processes are running on the
machine.
$>jvms
5622 ( ) - jmxterm.jar
4623 ( ) - sun.tools.jconsole.JConsole
2094 (m) - org.apache.catalina.startup.Bootstrap start
Open the connection to the Catalina JVM using the process ID.
$>open 2094
#Connection to 2094 is opened
The domains command lists the domains available in the Java process.
$>domains
#following domains are available
Catalina
JMImplementation
Magnolia
Users
com.sun.management
java.lang
java.util.logging
net.sf.ehcache
Set the domain to Magnolia.
$>domain Magnolia
#domain is set to Magnolia
The beans command provides a list of MBeans in the domain. Here are
the beans in the Magnolia domain.
$>beans
#domain = Magnolia:
Magnolia:domain=magnoliaAuthor,type=CacheMonitor
Magnolia:domain=magnoliaAuthor,type=JCRStats
Magnolia:domain=magnoliaPublic,type=CacheMonitor
Magnolia:domain=magnoliaPublic,type=JCRStats
We need the CacheMonitor bean for the public instance.
$>bean Magnolia:domain=magnoliaPublic,type=CacheMonitor
#bean is set to Magnolia:domain=magnoliaPublic,type=CacheMonitor
info tells you what a bean does. The CacheMonitor bean provides
several attributes and operations.
$>info
#mbean = Magnolia:domain=magnoliaPublic,type=CacheMonitor
#class name = info.magnolia.module.cache.mbean.CacheMonitor
\# attributes
  %0   - All (java.util.Map, r)
  %1   - Bypasses (int, r)
  %2   - CachedKeysCount (int, r)
  %3   - CachedUUIDsCount (int, r)
  %4   - DomainAccesses (java.util.Map, r)
  %5   - Flushes (java.util.Map, r)
  %6   - Hits (int, r)
  %7   - Puts (int, r)
  %8   - StartCalls (int, r)
  %9   - StopCalls (int, r)
\# operations
  %0   - void flushAll()
  %1   - void flushByUUID(java.lang.String p1,java.lang.String p2)
#there's no notifications
Invoke the flushAll operation to flush the cache.
$>run flushAll
#calling operation flushAll of mbean Magnolia:domain=magnoliaPublic,type=CacheMonitor
#operation returns:
null
Let’s see how many times the cache has been flushed by checking the
Flushes attribute with the get command. This particular operation
does not return any value, just null.
$>get Flushes
#mbean = Magnolia:domain=magnoliaPublic,type=CacheMonitor:
Flushes = {
  uuid-key-mapping = 3;
  default = 3;
 };
Three times, it seems.
Example: Running a Jmxterm script
Jmxterm can read a script file with the -i <input script> command line
option.
Save the following script as script.txt:
open <JVM process ID>
get -d Magnolia -b Magnolia:domain=magnoliaPublic,type=JCRStats SessionCount
get -d Magnolia -b Magnolia:domain=magnoliaPublic,type=CacheMonitor All
quit
Replace <JVM process ID> with the ID of the Java Virtual Machine that
is executing the Magnolia application. You can find it with
ps | grep jvm.
Execute the script with:
$ java -jar jmxterm.jar -n -i script.txt -o output.txtwhere
-
-nsets Jmxterm to non-interactive mode. -
-i <input script>reads the script. -
-o <output file>writes the output to a file.
You should get results like this in the output file:
SessionCount = 12;
CachedUUIDsCount = 7;