Installing Connected Services Monitoring
When setting up Connected Services monitoring, you will need to:
-
Add the instrumentation module to the Magnolia web app
-
Add the Instrumentation Configuration module to the Magnolia
-
Add the instrumentation Exporter module to the Magnolia web app
-
Configure the Connected Services endpoint to collect Magnolia metrics
|
Each Magnolia instance that will be monitored must have the Instrumentation module installed and the Instrumentation configuration module installed or manually configured instrumentation probes set up. Each Magnolia instance that will be monitored must also have the instrumentation export module installed and configured to send monitoring metrics to the Connected Services cloud. |
The Connected Services cloud provides:
-
a Prometheus instance to collect and store Magnolia metrics
-
a Grafana instance to display the monitoring dashboards
-
an aggregation service that stores Magnolia metrics until collected by the Prometheus server
|
In on-premises monitoring, the Prometheus server calls the monitored Magnolia instance to collect metrics (in other words, Prometheus pulls the metrics from Magnolia). In Connected Services monitoring, the Prometheus server cannot contact the Magnolia instance. Instead, the Prometheus instance calls the aggregation service to collect Magnolia metrics (Prometheus pulls the metrics from the aggregation service) and Magnolia sends its metrics to the aggregation service (Magnolia pushes metrics to the aggregation service). |
Installing with Maven
Maven is the easiest way to install the module. Add the following to your bundle:
<dependency>
  <groupId>info.magnolia.services</groupId>
  <artifactId>instrumentation</artifactId>
  <version>2.4</version>
</dependency>
Add the Instrumentation Configuration module
The Instrumentation module comes with no bootstrap configuration: no probes will be automatically configured.
You can configure your own probes manually, or you can install the Instrumentation Configuration module.
The Instrumentation Configuration module comes with a standard set of configured instrumentation probes that will be bootstrapped into the Magnolia instance. The module is a good starting point for monitoring Magnolia; you can always add new probes or change the configuration of configured probes to meet your needs.
| the sample instrumentation dashboards are based on the probes defined in the Instrumentation Configuration module. Changing the probes configured in the Instrumentation Configuration module may affect the standard dashboards. |
Installing with Maven
Maven is the easiest way to install the module. Add the following to your bundle:
<dependency>
  <groupId>info.magnolia.services</groupId>
  <artifactId>instrumentation-monitoring</artifactId>
  <version>1.0-SNAPSHOT</version>
</dependency>
Adjusting the Instrumentation Configuration module
The Instrumentation Configuration module contains both bootstrap content and sample bootstrap content.
Automatically bootstrapped configuration:
-
Probes configured through module configuration (i.e. probes configured at /modules/instrumentation/config)
-
Configuration for the cloud monitoring solution (i.e. service configuration at /modules/instrumentation/config/csPushConfig)
-
Configuration for the Prometheus metrics servlet (i.e. /server/filters/servlets/MetricsServlet)
| The Prometheus metrics servlet must be configured for the on premise monitoring solution! If not present, Prometheus cannot collect measurements from Magnolia! |
| If you are using the cloud monitoring solution, you can remove the Prometheus metrics servlet at /server/filters/servlets/MetricsServlet. |
Sample bootstrapped configuration:
-
Filter probes
-
Rendering probes
-
Cache probes
-
assorted other probes (activation command probes, probes run as a scheduled jobs, etc.)
|
If the Magnolia instances is does not automatically bootstrap sample content, you’ll have to manually import the probe configurations yourself. The filter, rendering and cache probes are all used by the standard Instrumentation Dashboards. If they aren’t configured, some of the instrumentation dashboards will not be displayed correctly. The filter probes created from sample bootstrapped content will be added at the end of the filter chain, they should be moved to the beginning or near the beginning of the filter chain:
The above filters are meant to measure the total execution time of the filter chain, if they are not placed the very beginning of the filter chain, they should be as near to the beginning as possible. |
Adding the Instrumentation Exporter module
The Instrumentation Exporter module sends Magnolia metrics to the Connected Services aggregation service.
Installing with Maven
Maven is the easiest way to install the module. Add the following to your bundle:
<dependency>
  <groupId>info.magnolia.services</groupId>
  <artifactId>instrumentation-exporter</artifactId>
  <version>1.1</version>
</dependency>
Configuring the Instrumentation Exporter module
The Instrumentation Exporter module must be configured to push Magnolia metrics to the Connected Services cloud.
You will need:
-
a Connected Services client ID
-
a Connected Services JWT token
-
a Connected Services path
In addition, you may need:
-
a Connected Services endpoint URL, the default is https://streamer-exp.magnolia-cloud-services.com/crocodile
-
a target ID for the Magnolia instance being monitored, the default target IDs available are author-localhost, public-localhost-0, public-localhost-1
-
a monitoring key, the default is .monitoring/scrape
When your Connected Service access is set up, you will be provided with all of the above.
The Instrumentation Exporter module will bootstrap an example configuration for Connected Services but it is not complete.
Instrumentation Exporter and dynamic configuration
The standard instrument exporter configuration requires identifying the Magnolia instance with the targetId property.
Configuring the targetId may not be possible when a new Magnolia instance is created and started automatically, for example when starting a new Magnolia public instance to handle increased traffic or to replace a failed Magnolia instance, or, in other words, auto-scaling scenarios.
There are two important configuration settings that may change from monitored instance to instance:
-
the target ID: the name identifying the Magnolia when metrics are stored in Prometheus
-
the metric collection interval: how frequently metrics are collected from the Magnolia instance and sent to Connected Services monitoring
| The Instrumentation Exporter module v1.0 supports only static configuration of the target ID and metric collection interval. The Instrumentation Export module v1.1 supports either static configuration of the target ID and metric collection interval or dynamic configuration of the target ID and metric collection interval. |
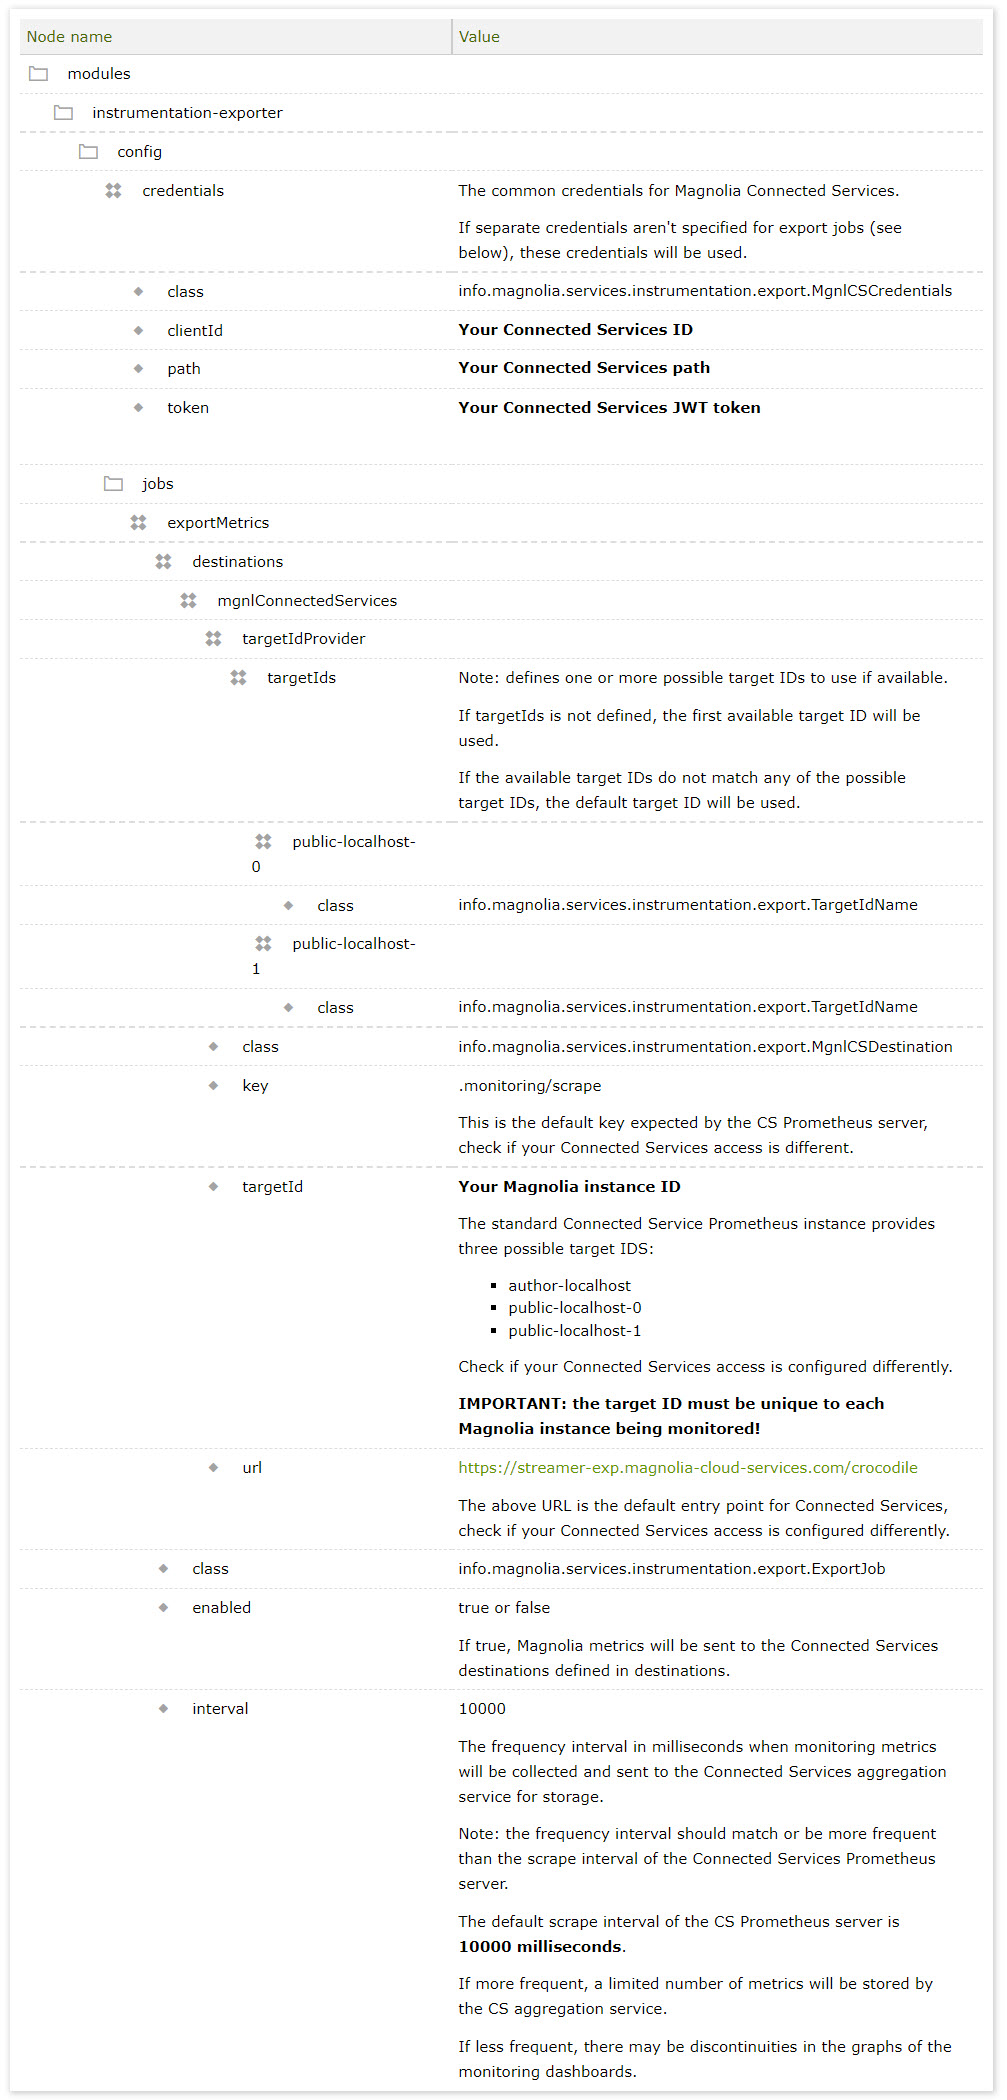
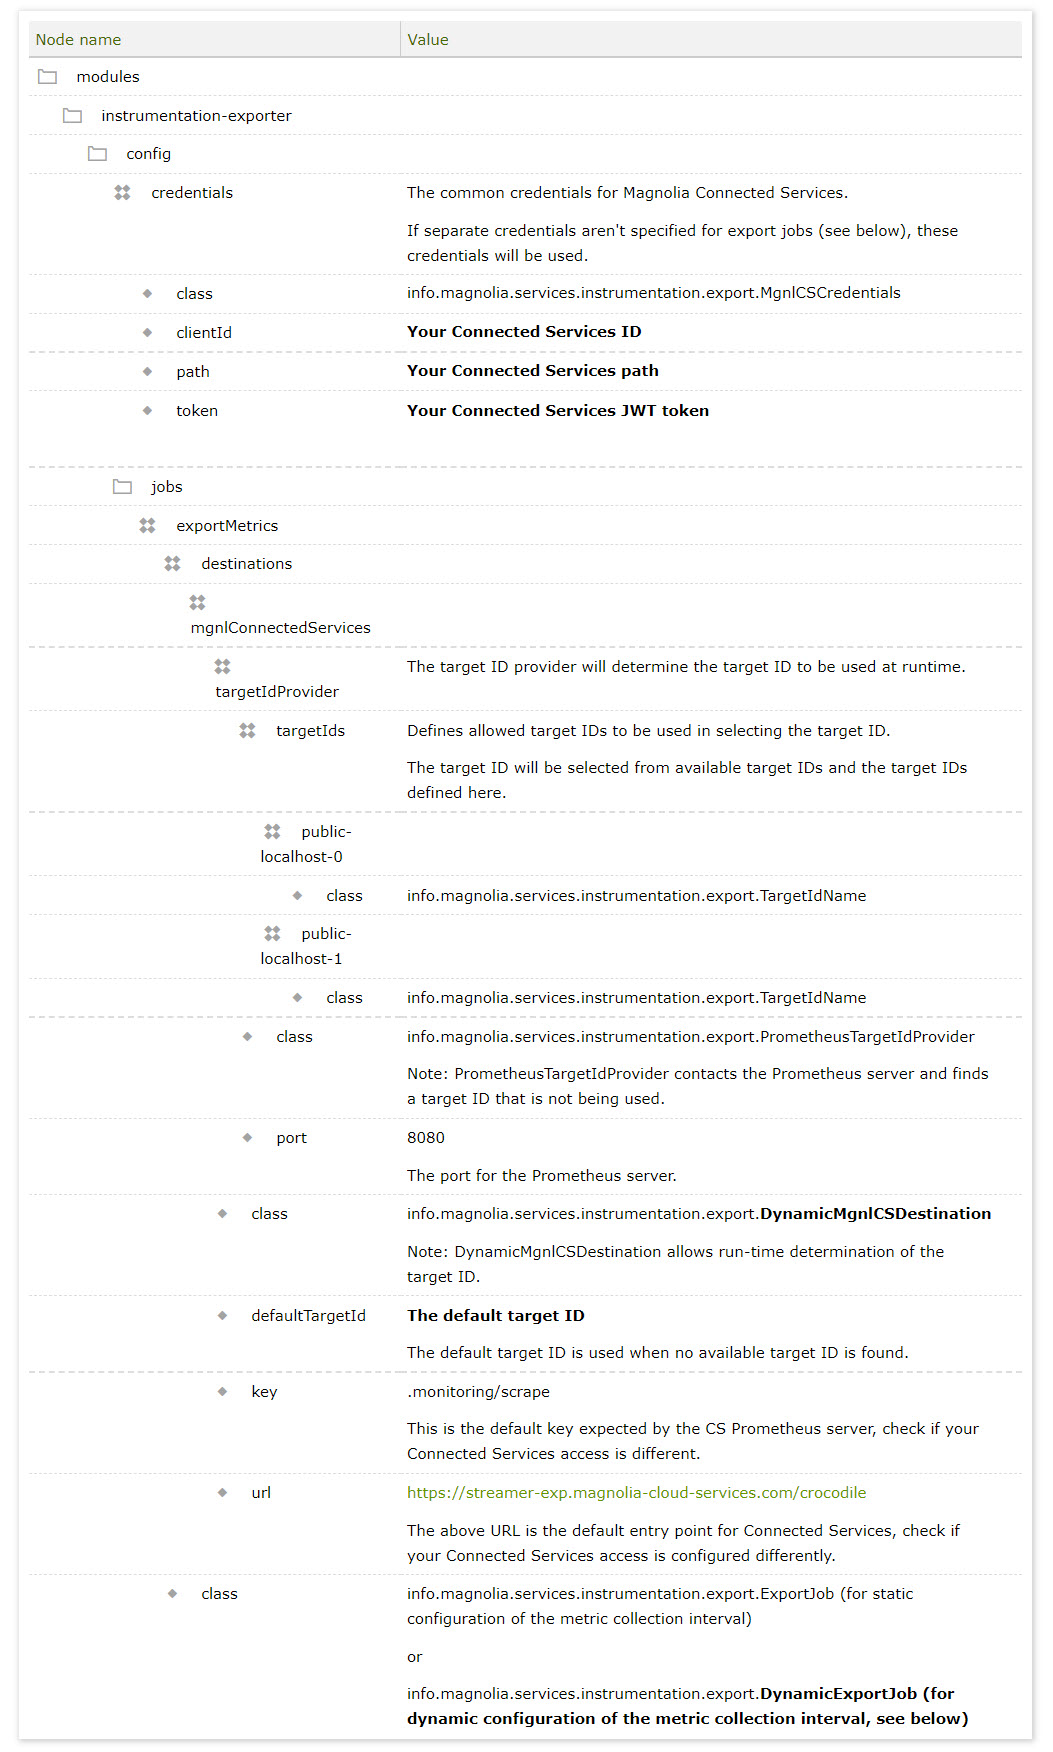
Dynamic target ID configuration
The target ID should be unique among the Magnolia instances being monitored and it must match one of the configured targets set up in Connected Services monitoring.
The standard Connected Services monitoring configuration supports three targets:
-
author-localhost-0
-
public-localhost-0
-
public-localhost-1
You can dynamically pick the target ID when your Magnolia instance starts up by using info.magnolia.services.instrumentation.export.DynamicMgnlCSDestination instead of info.magnolia.services.instrumentation.export.MgnlCSDestination.
Here’s how it works.
-
the Magnolia instance contacts the Prometheus and requests the status of all configured targets
-
the Magnolia instance selects an unused target ID and sends its metrics to the selected target ID
-
if all else fails, the Magnolia instance sends its metrics to a default target ID
Here’s an example configuration:
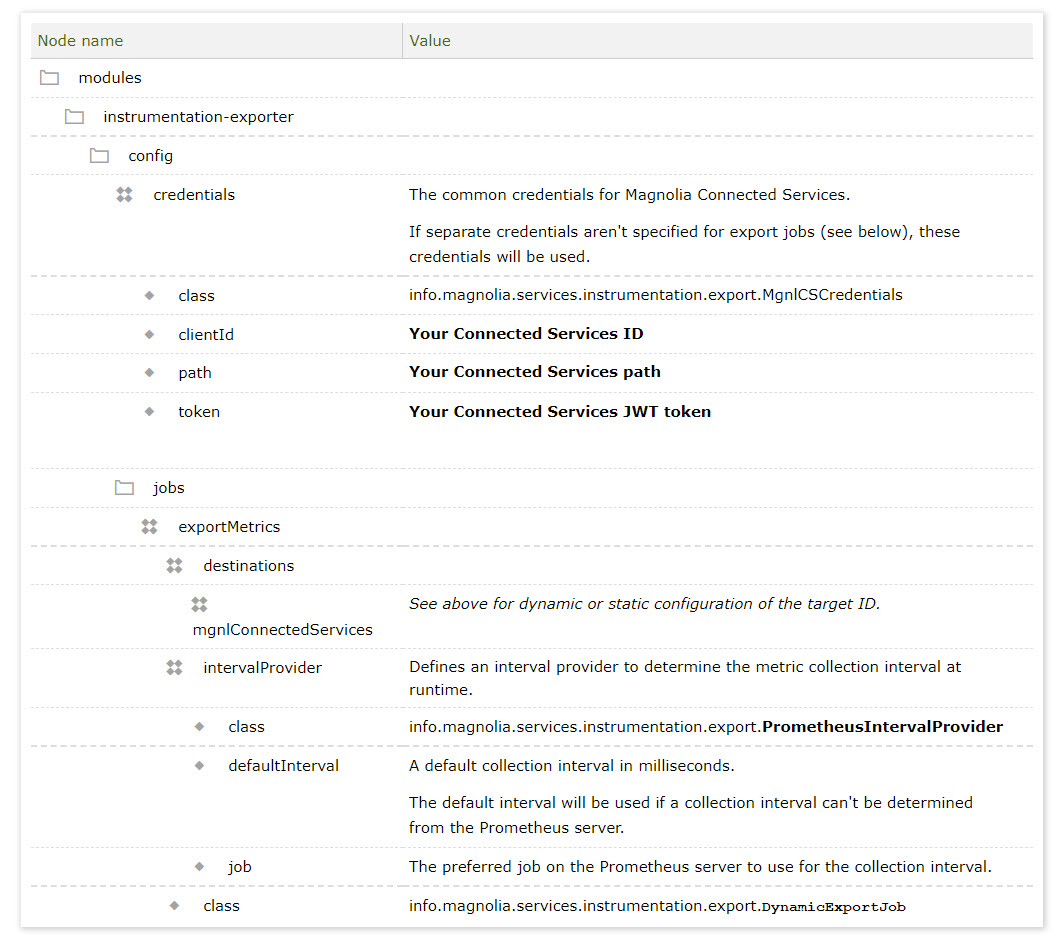
Dynamic metric collection interval configuration
The metric collection interval defines the frequency at which Magnolia metrics are collected at sent to Magnolia Connected Services. The interval should match the frequency at which Prometheus collects and stores the metrics, officially the scrape_interval of the job.
The scrape_interval is defined in the Prometheus configuration and depends on the configuration of your Connected Services monitoring.
Here’s how it works.
-
the Magnolia instance contacts the Magnolia Connected Services and gets the configuration of the Prometheus server
-
the Magnolia instance selects a collection interval from the jobs defined in the Prometheus server
-
if all else fails, the Magnolia instance uses the default metric collection interval
The above process defines a precedence for what determines the metric collection interval:
-
the scrape interval for the configured job (the intervalProvider@job property), if configured and defined in Prometheus
-
the global scrape interval for the Prometheus server, if the job is not found or configured and the global scrape interval is defined in Prometheus
-
the default interval (the intervalProvider@defaultInterval property), if configured
-
the configured value of the ExportJob "interval" property, if configured
Here’s an example configuration: