Run time probes
Run time probes collect to two things: when the Java Virtual Machine was started how long it has been running. In addition, information about the JVM is collected and saved as labels.
Run time probes can measure:
-
when the JVM running Magnolia was started
-
how long (in milliseconds) the JVM has been running
Collecting run time metrics
You have two options for collecting run time metrics:
Use RuntimeProbe (info.magnolia.services.instrumentation.probes.environment.RuntimeProbe) to collect run time metrics. RuntimeProbe will create separate metrics for each system usage characteristic. OSProbe is configured as an instrumentation module probe and the metrics will be measured when Prometheus collects all metrics from Magnolia.
Use RuntimeProbeCommand (info.magnolia.services.instrumentation.probes.commands.RuntimeProbeCommand) to collect run time metrics. RuntimeProbeCommand is a Magnolia command that collects the configured metrics when executed.
Executions of RuntimeProbeCommand can be scheduled with the Scheduler module. You can also execute the OSProbeCommand through the command REST endpoint, see the REST module.
RuntimeProbeCommand will store its measurements as a single metric with the metric labels identifying what was measured.
- Use RuntimeProbe when
-
-
you want separate metrics for each run time metric
-
- Use RuntimeProbeCommand when
-
-
you want to measure the run time metrics more frequently or less frequently than the collection of metrics from Magnolia
-
you want a single metric for all measurements
-
you want to invoke the collection of run time metrics remotely
-
you want one, but not both, run time metrics
-
RuntimeProbe
The RuntimeProbe records when the JVM was started and how long it has been running.
RuntimeProbe is an instrumentation module probe and is configured in the instrumentation module.
Configuration properties
| Property | Description | Required | ||
|---|---|---|---|---|
|
Should be |
|||
|
The probe name.
|
|||
|
The metric name. Default
|
|||
|
The metric description. |
|||
|
Specifies the metric to be collected, must be one of:
|
Metrics
| Metric | Description |
|---|---|
|
When the JVM was started as a Unix epoch time in milliseconds. |
|
The number of milliseconds the JVM has been running. |
Labels
| Label | Metric | Description |
|---|---|---|
|
|
The name representing the running Java virtual machine. The returned name string can be any arbitrary string and a Java virtual machine implementation can choose to embed platform-specific useful information in the returned name string. Each running virtual machine could have a different name. |
|
|
The Java virtual machine specification name. |
|
|
The Java virtual machine specification version. |
|
|
The Java virtual machine specification vendor. |
|
|
The Java virtual machine implementation name. |
|
|
The Java virtual machine implementation version. |
|
|
The Java virtual machine implementation vendor. |
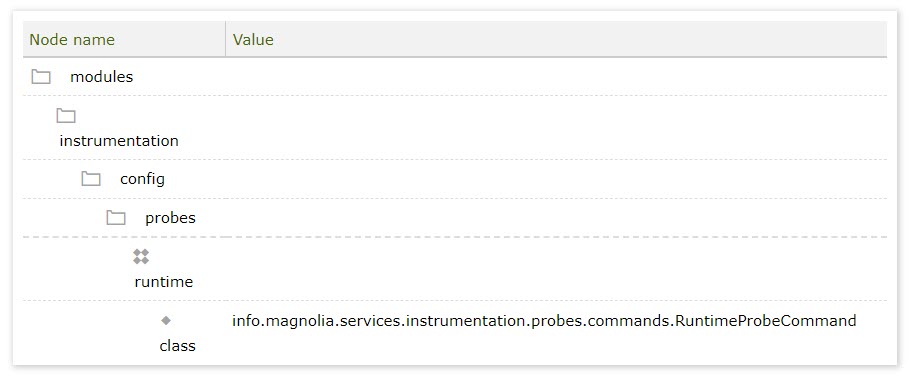
RuntimeProbeCommand
The RuntimeProbeCommand records when the JVM started or how long it has been running, along with details about the Java Virtual Machine running Magnolia.
RuntimeProbeCommand can collect two metrics:
-
StartTime- when the JVM was started in milliseconds -
Uptime- how long the JVM has been running in milliseconds
Along with the measured metric, RuntimeProbeCommand adds the details about the JVM as labels.
Unlike other probes, RuntimeProbeCommand is a Magnolia command. RuntimeProbeCommand only measures its metrics when executed as a command. You will have to arrange for the execution of RuntimeProbeCommand in order to measure its metrics, say with the Scheduler module or the REST command endpoint.
The RuntimeProbeCommand properties metric, probeName and probeDescription can be specified in the command parameters passed during execution and will override the configured values of the properties.
| See Commands for more on Magnolia commands. |
Configuration properties
| Property | Description | Required | ||
|---|---|---|---|---|
|
Should be |
|||
|
The command name.
|
|||
|
The metric name. Default
|
|||
|
The metric description. |
|||
|
Specifies the metric to be collected, must be one of:
|
Labels
| Label | Metric | Description |
|---|---|---|
|
|
The specified metric, will be either |
|
|
The name representing the running Java virtual machine. The returned name string can be any arbitrary string and a Java virtual machine implementation can choose to embed platform-specific useful information in the returned name string. Each running virtual machine could have a different name. |
|
|
The Java virtual machine specification name. |
|
|
The Java virtual machine specification version. |
|
|
The Java virtual machine specification vendor. |
|
|
The Java virtual machine implementation name. |
|
|
The Java virtual machine implementation version. |
|
|
The Java virtual machine implementation vendor. |