Instrumentation dashboards
This page provides a preview into Grafana Instrumentation dashboards.
| These dashboards are updated frequently, so they aren’t described in detail and the documentation may not reflect their current state. |
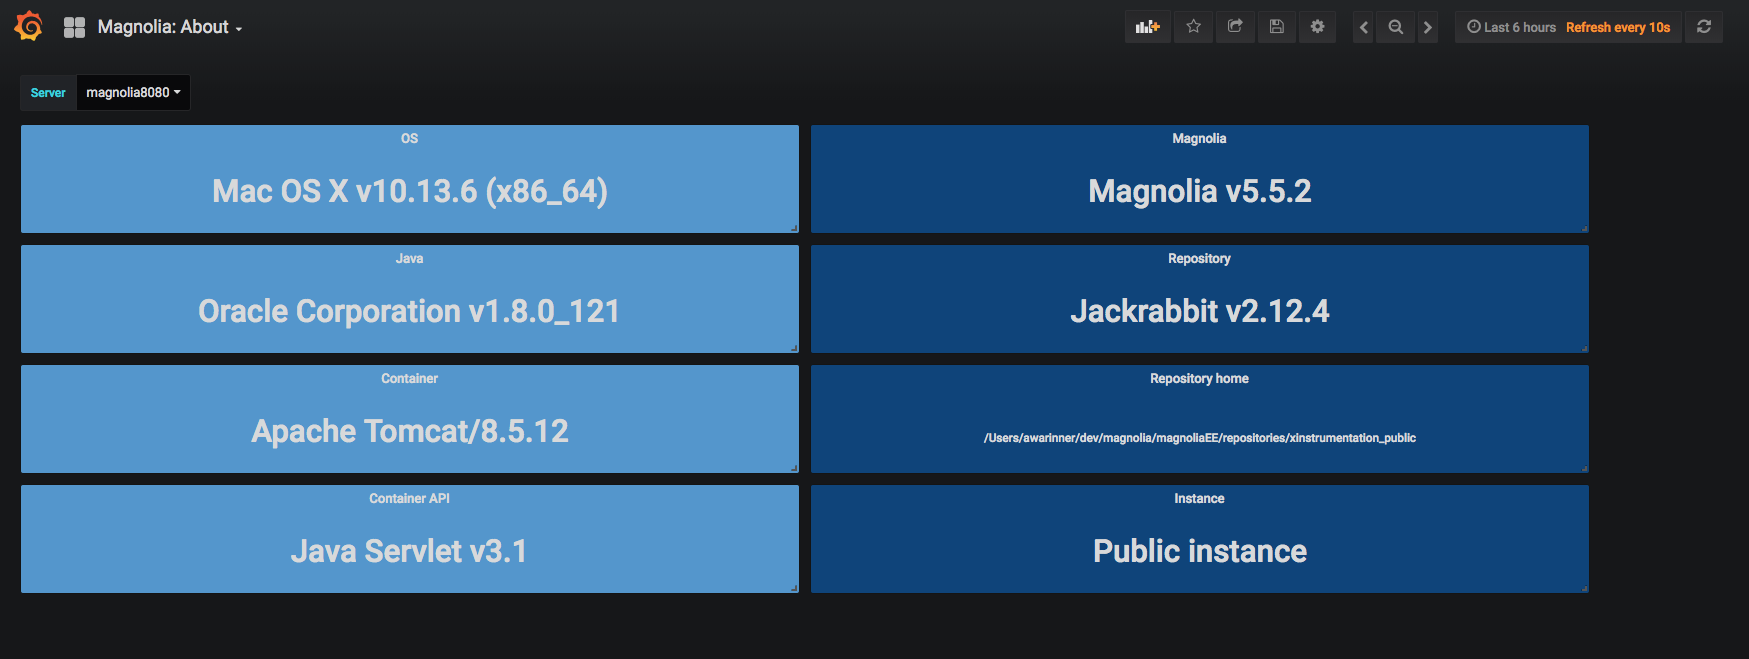
Magnolia: About
- This dashboard
-
visualizes details about the Magnolia server.
Displays details from a selected Magnolia server:
-
the operating system and its version
-
the JVM vendor and version
-
the web app container and version
-
the Java Servlet API version
-
the Magnolia core version
-
the JCR repository and version
-
the repositories home directory
-
Magnolia instance type: public or author
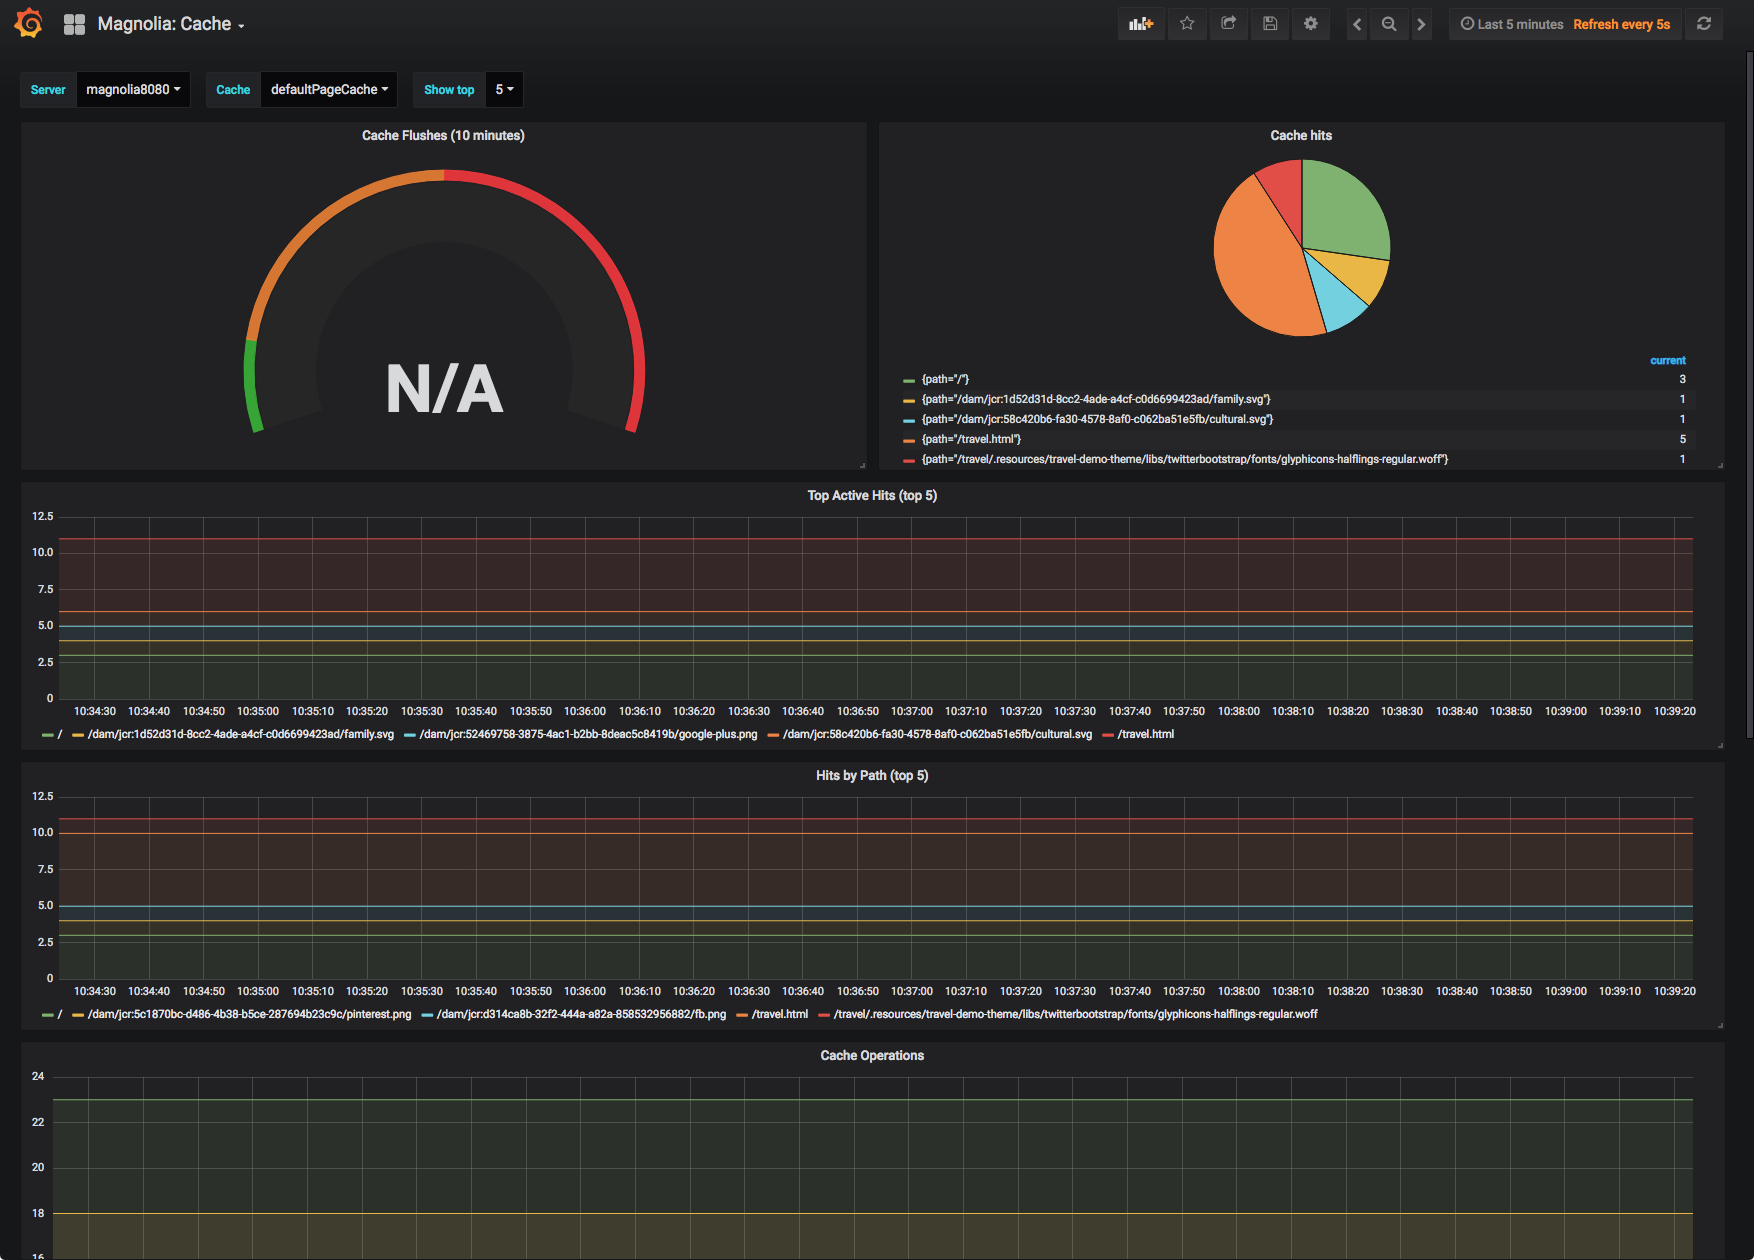
Magnolia: Cache
- This dashboard
-
visualizes results of cache probes.
Displays cache usage details from a selected Magnolia server:
-
cache flush rate
-
cache hits breakdown
-
top cache hits over time
-
top cache hits by path over time
-
cache operations over time
-
cache puts over time
-
cache flushes over time
-
cache flush rate over time
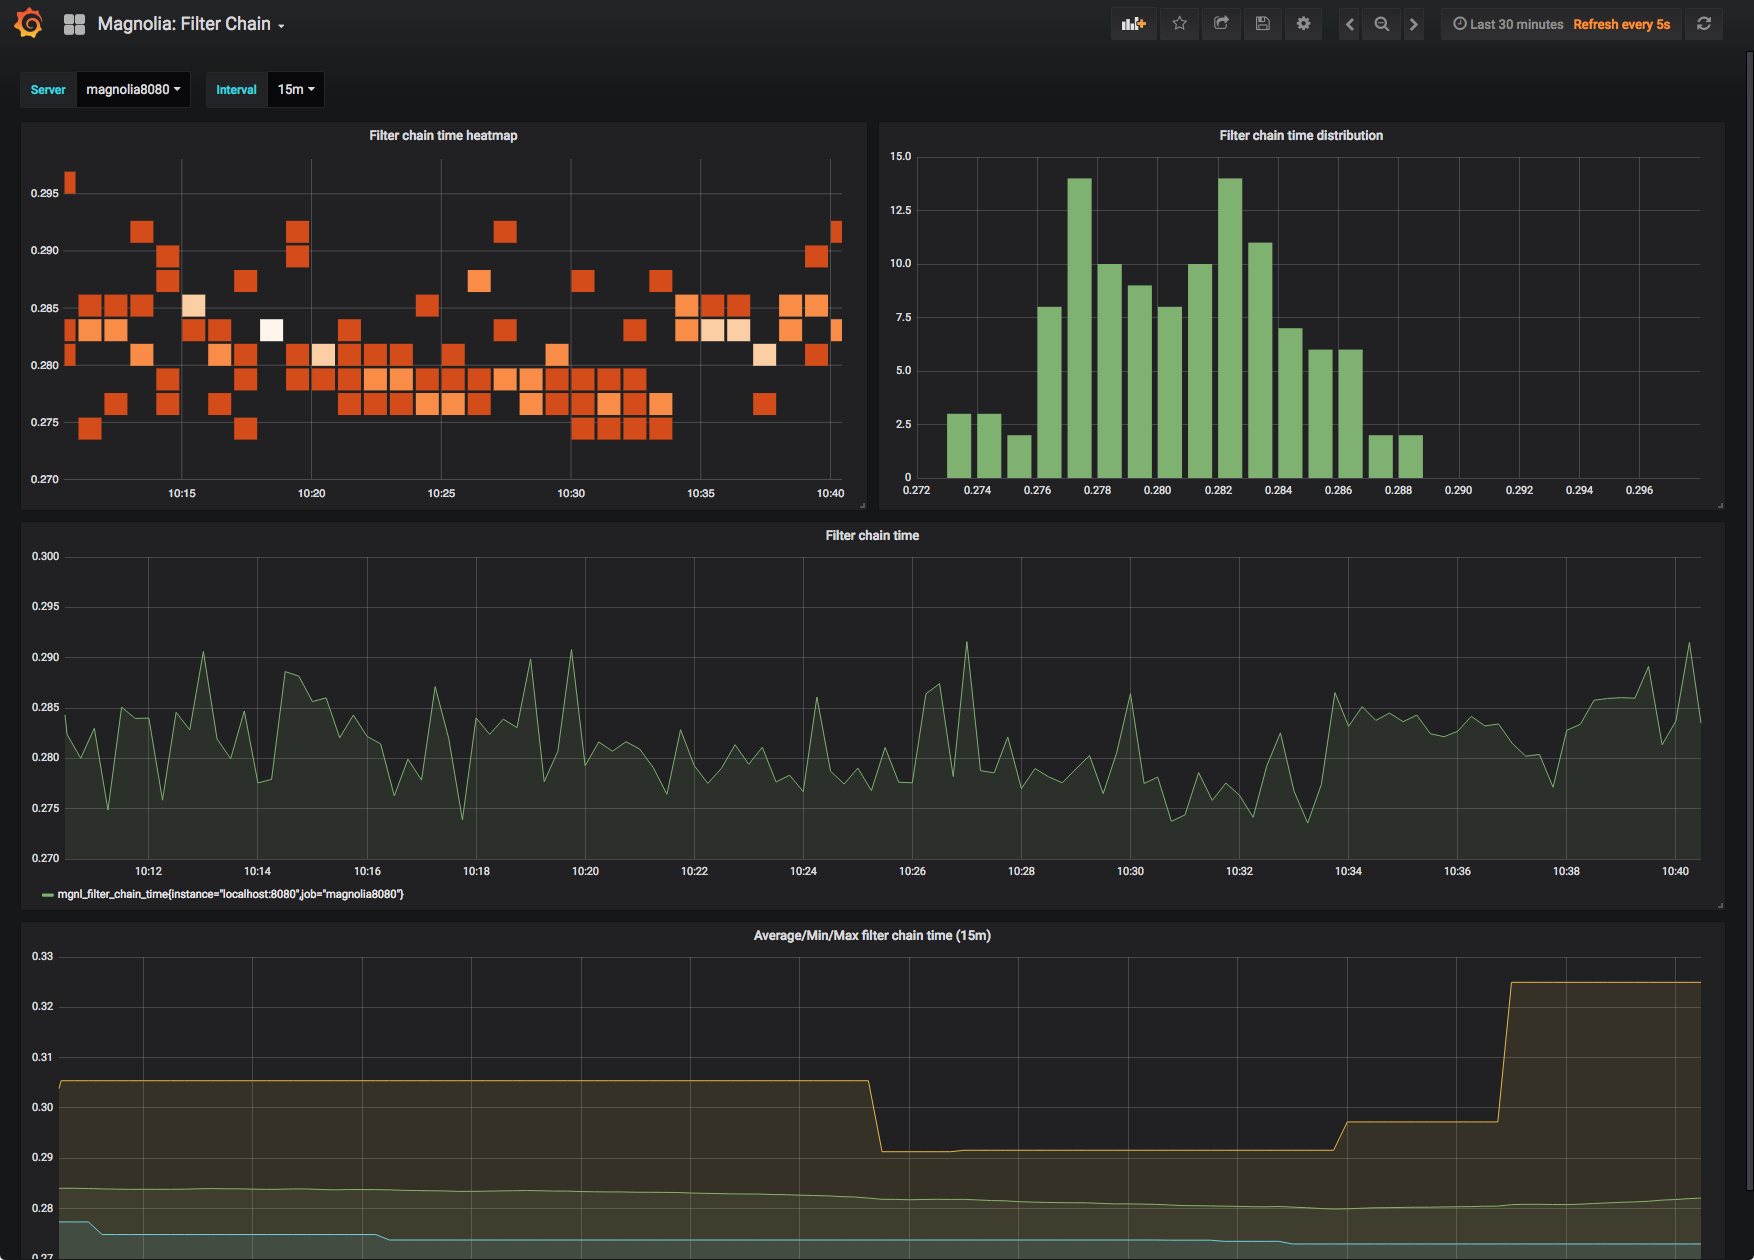
Magnolia: Filter Chain
- This dashboard
-
visualizes results of filter chain probes.
Displays timings of the Magnolia filter chain from a selected Magnolia server:
-
filter chain execution time distribution
-
filter chain execution time heatmap
-
average/min/max filter chain execution time
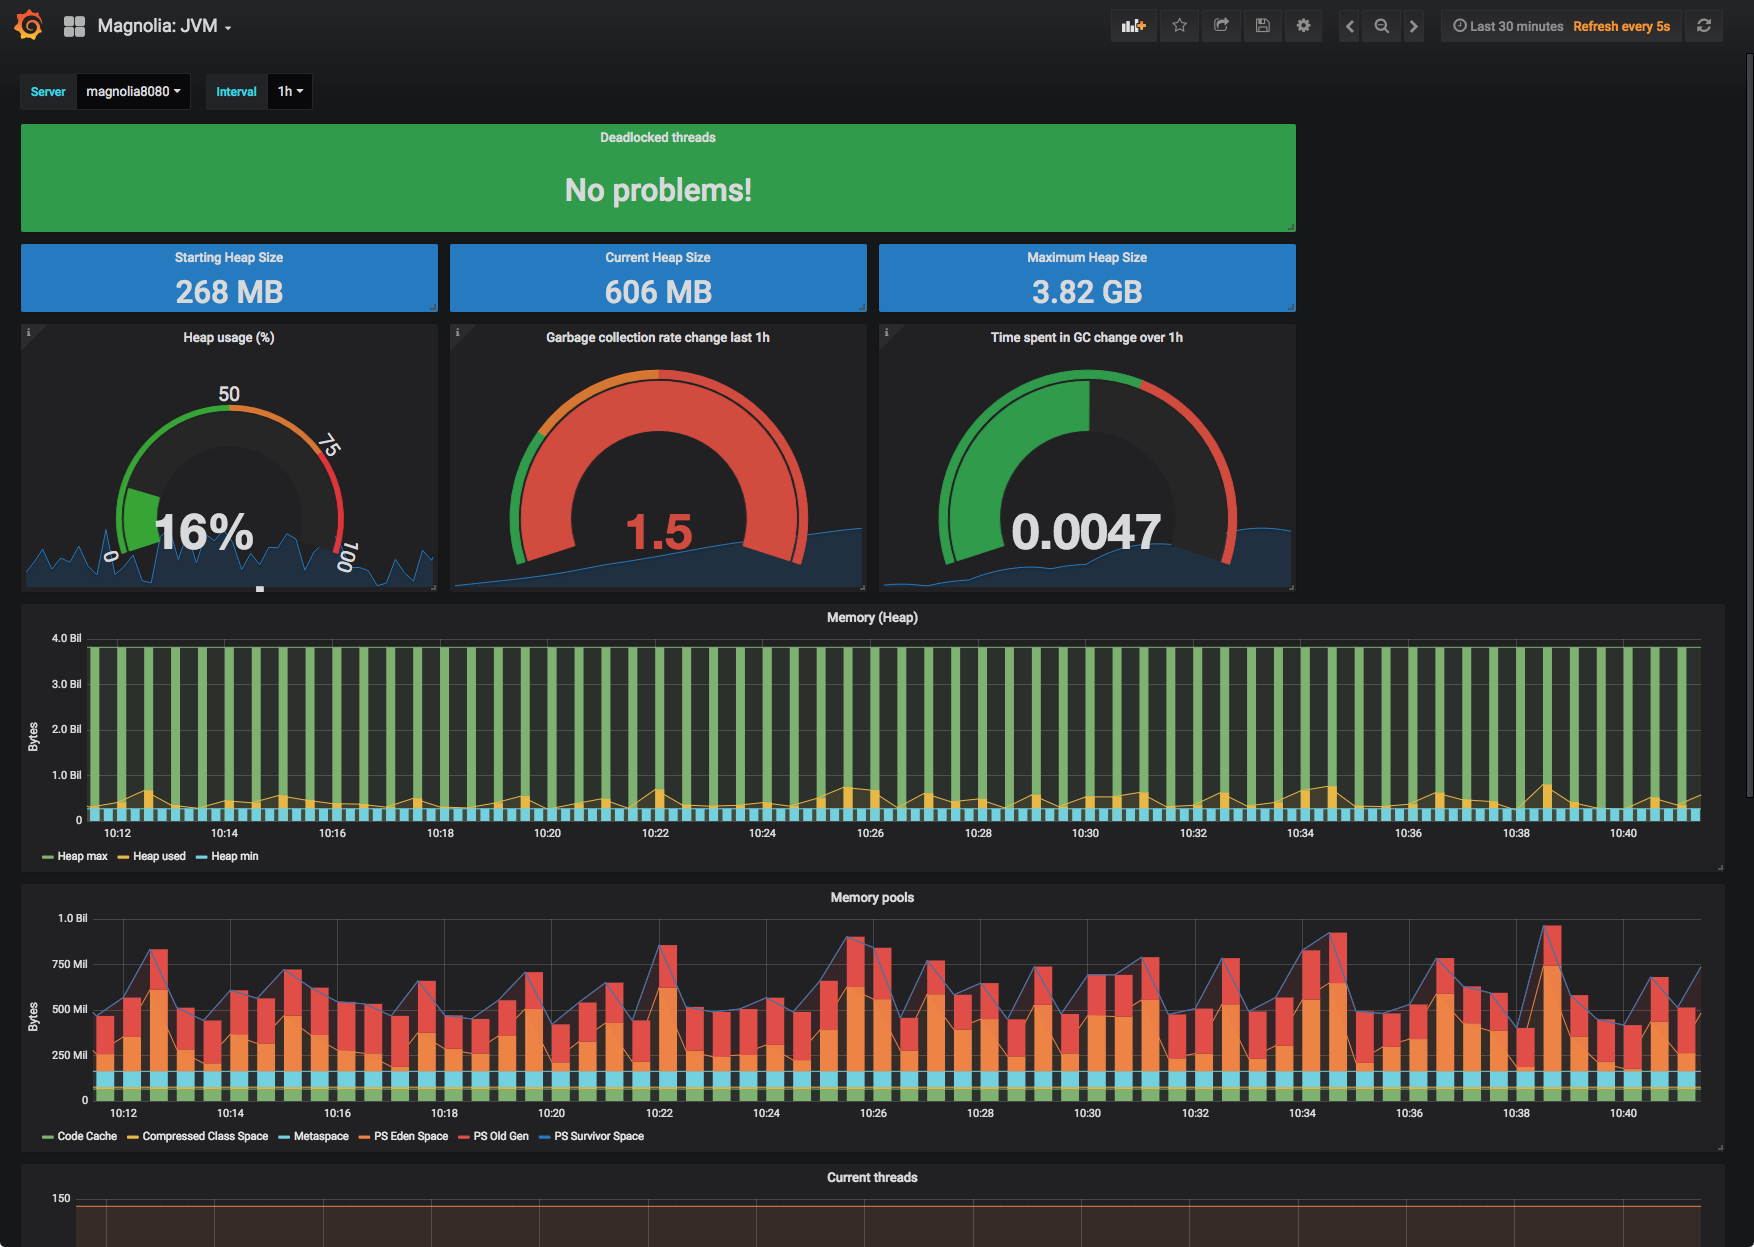
Magnolia: JVM
- This dashboard
-
visualizes results of JVM probes.
Displays details of the JVM running a selected Magnolia server:
-
deadlocked threads warning
-
starting heap size
-
current heap size
-
max heap size
-
heap usage gauge
-
garbage collection rate gauge
-
garbage collection time gauge
-
heap usage over time
-
memory pool usage over time
-
thread usage over time
-
garbage collection execution time
-
garbage collection executions over time

Magnolia: Logging
- This dashboard
-
visualizes results of logging probes.
Displays details about logging messages from a selected Magnolia server:
-
message source breakdown
-
error messages over time
-
messages by level over time
-
message sources over time
-
labeled messages over time
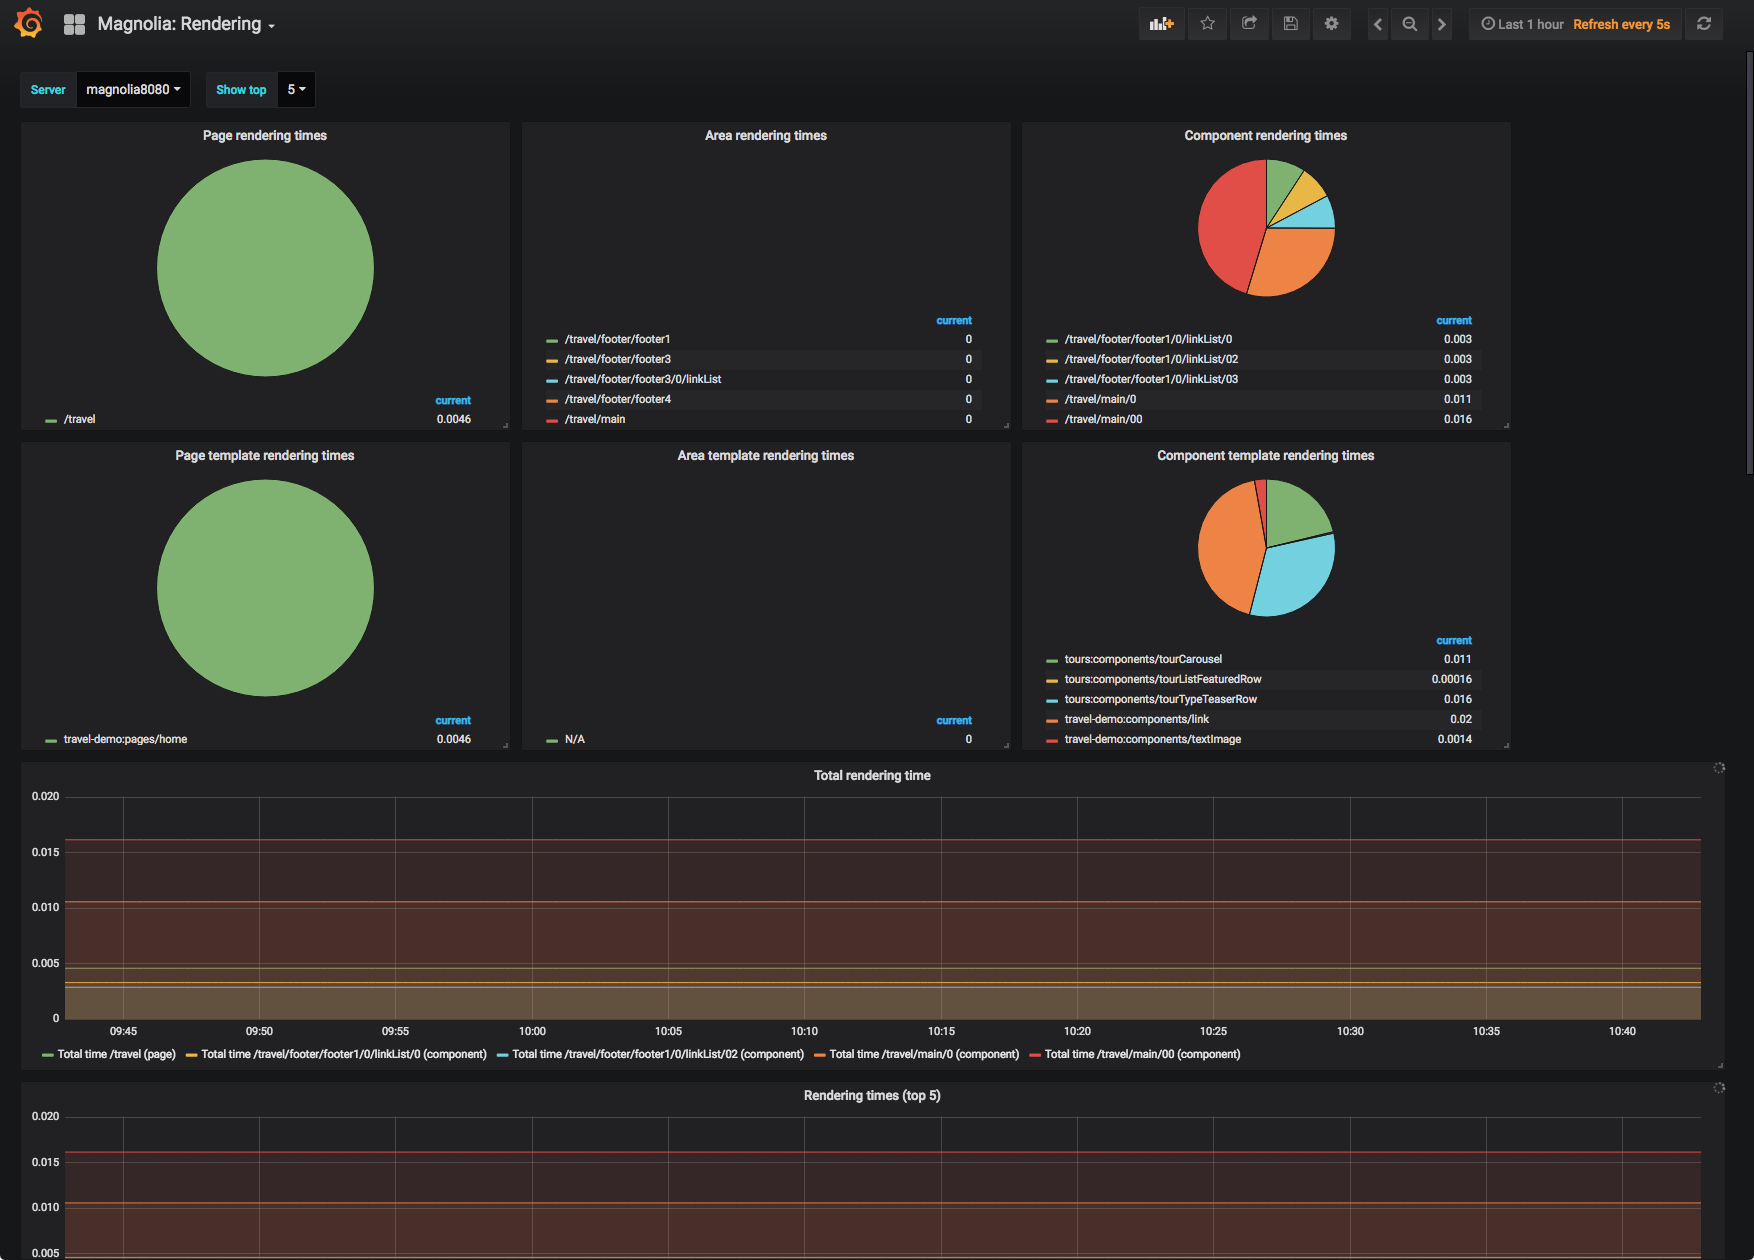
Magnolia: Rendering
- This dashboard
-
visualizes results of rendering probes.
Displays details about the rendering times from a selected Magnolia server:
-
rendering times breakdown for pages, areas, and components
-
rendering times breakdown for page, area and component templates
-
total rendering times over time
-
individual rendering times over time
-
individual rendering times table
-
page rendering times over time
-
page rendering times table
-
area rendering times over time
-
area rendering times table
-
component rendering times over time
-
component rendering times table
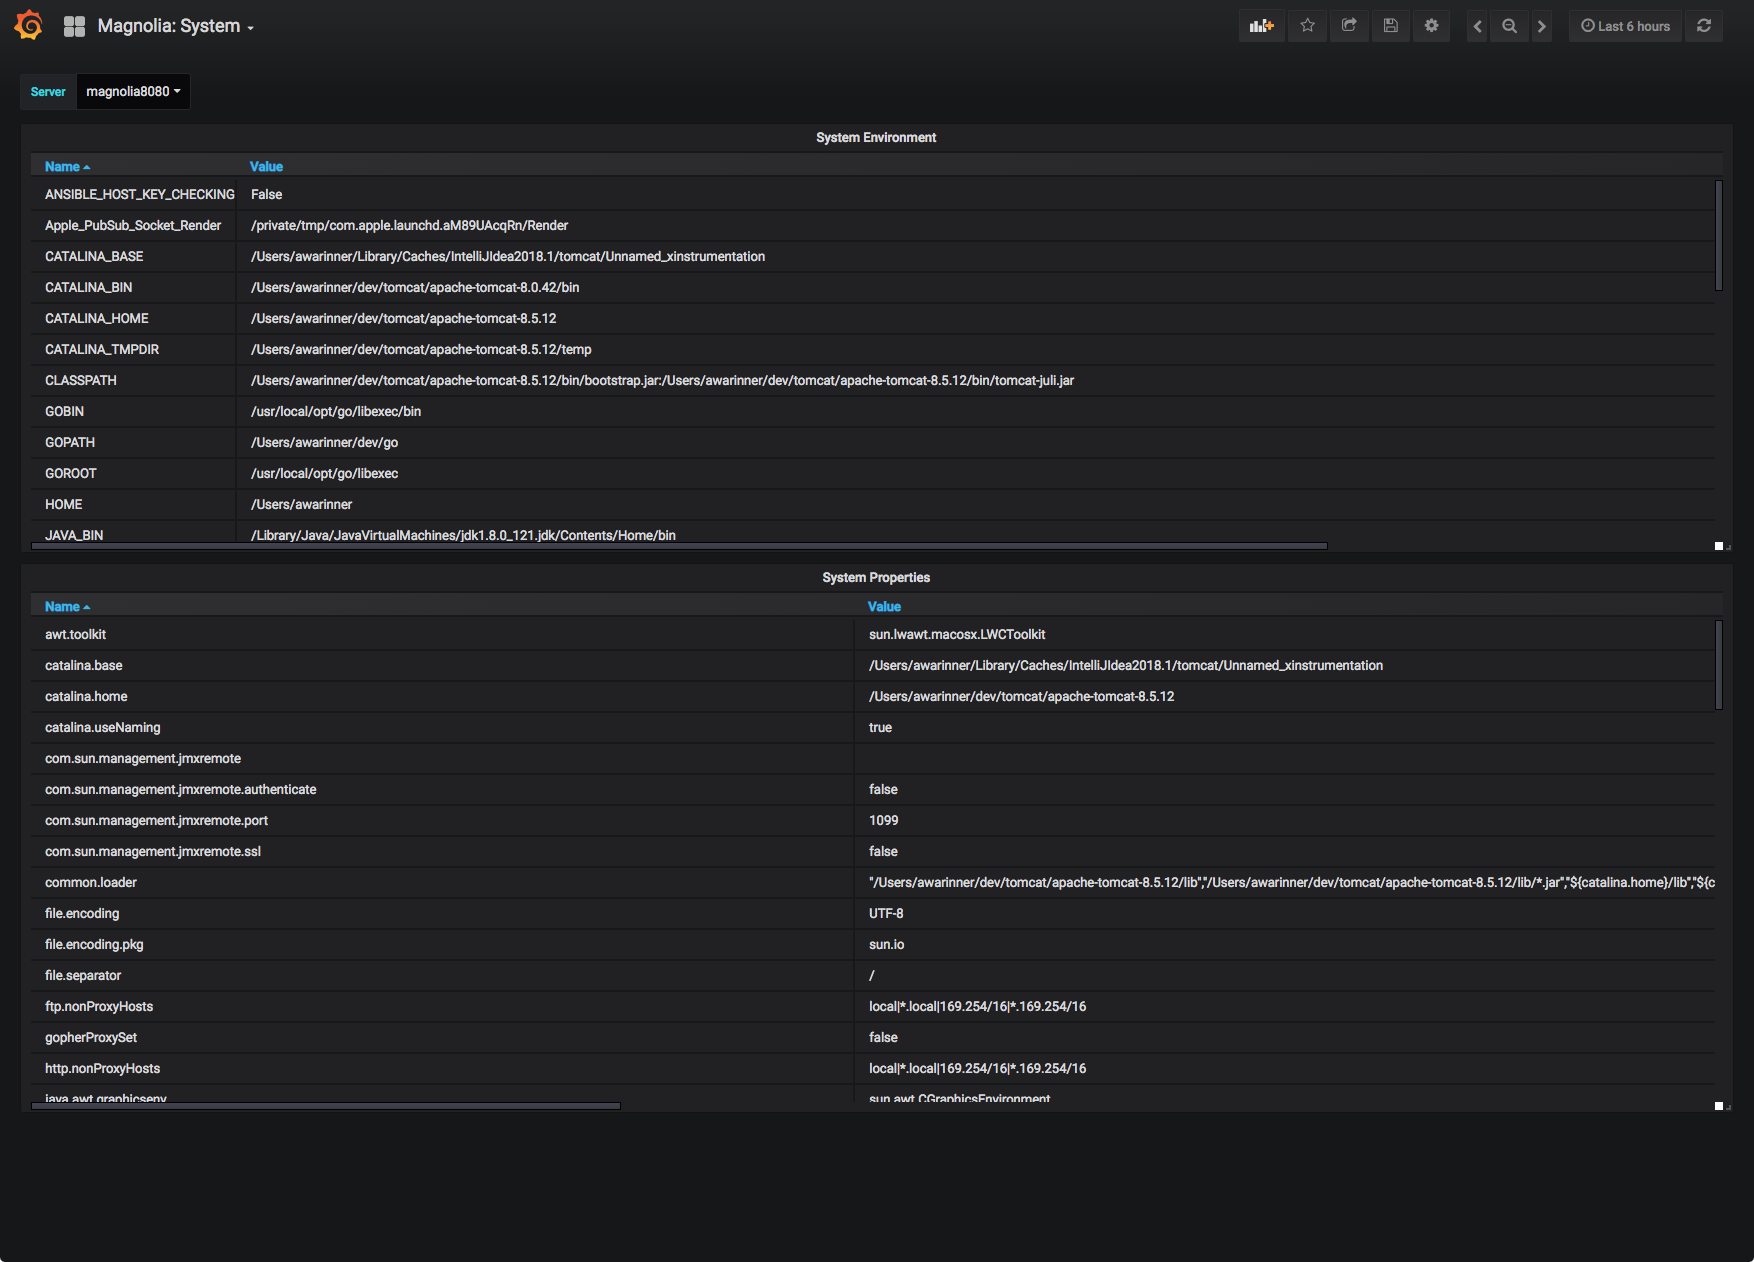
Magnolia: System
- This dashboard
-
visualizes results of system probes.
Displays details about the system environment from a selected Magnolia server:
-
System environment properties table
-
System properties table
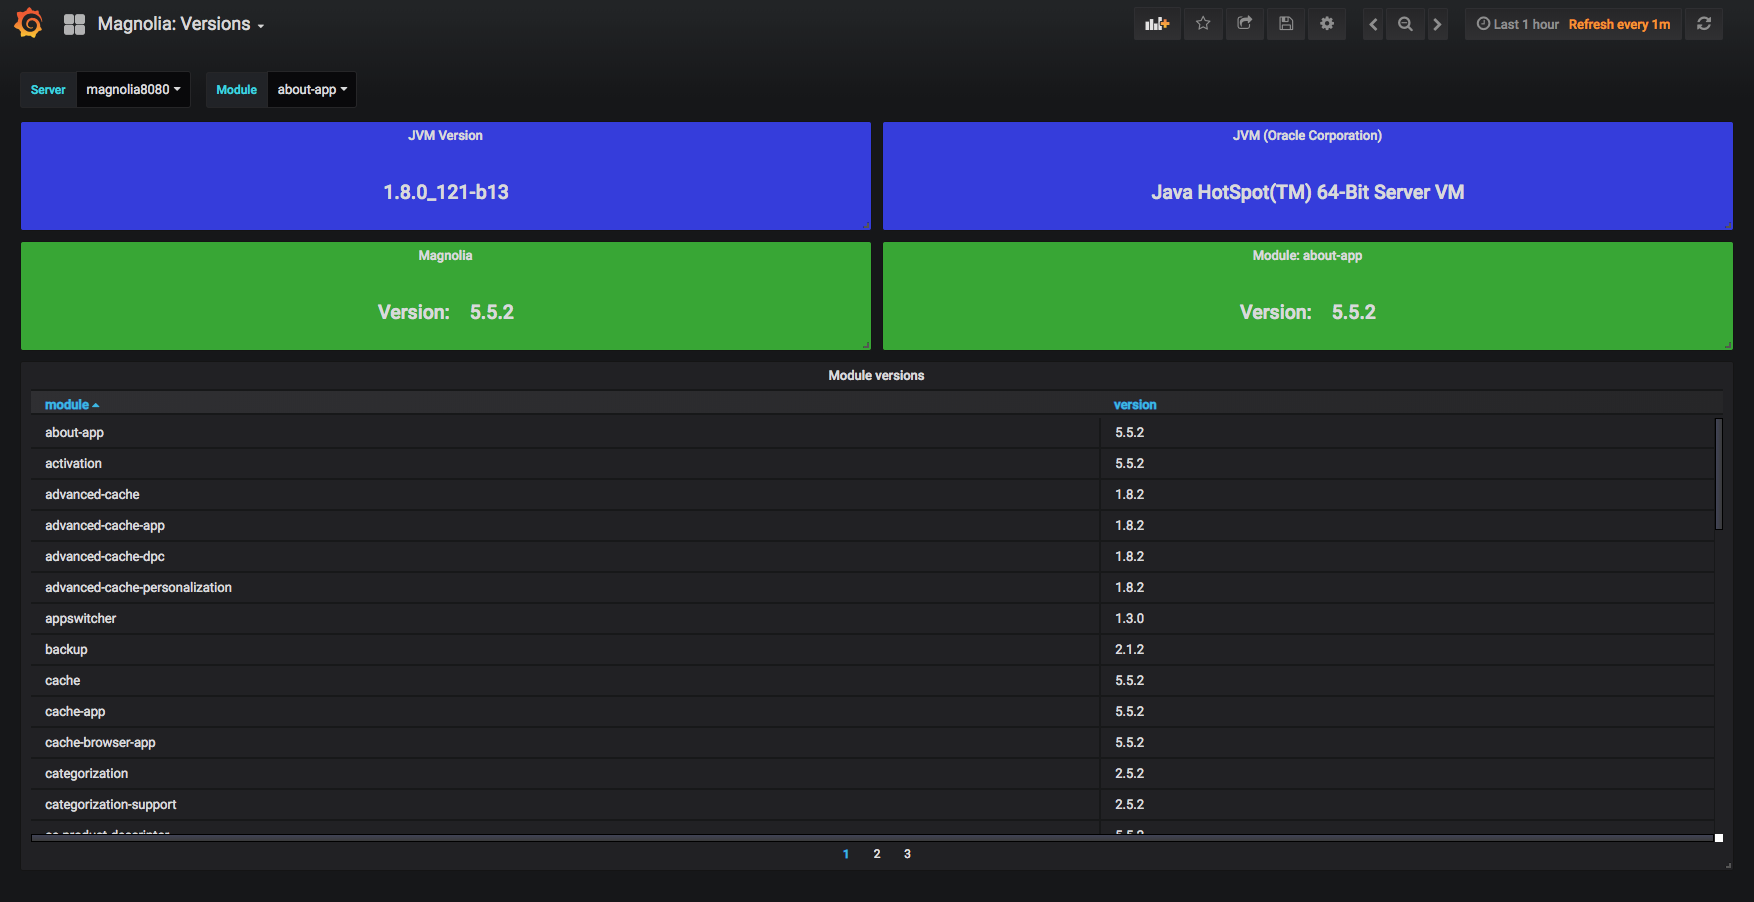
Magnolia: Versions
- This dashboard
-
visualizes results of modules probes.
Displays details about installed Magnolia modules from a selected Magnolia server:
-
JVM version display
-
JVM details display
-
Magnolia core version display
-
Selected Magnolia module version display
-
Magnolia module versions table
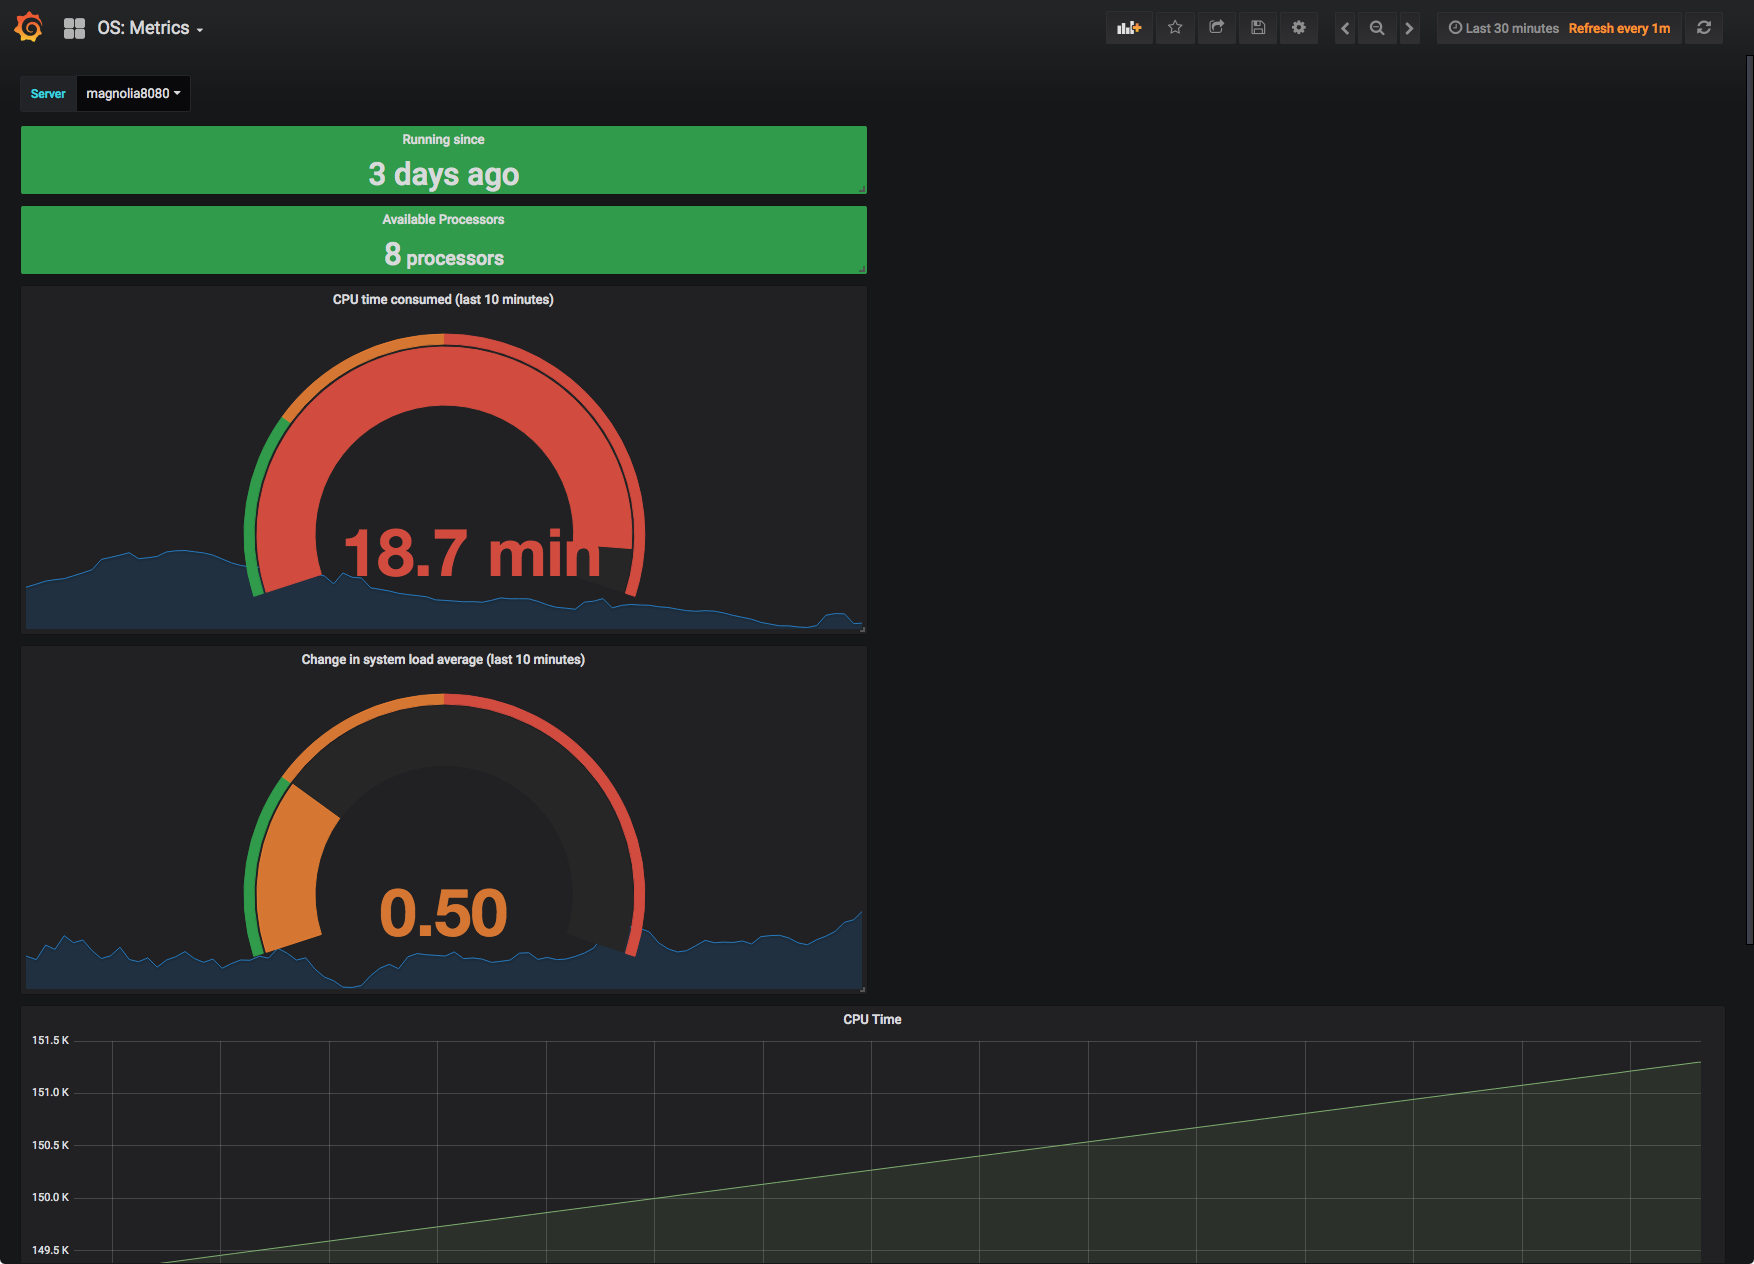
OS: Metrics
- This dashboard
-
visualizes runtime metrics of JVM probes.
Displays details about the process running a selected Magnolia server:
-
JVM running time display
-
available processors display
-
CPU time usage gauge
-
change in average system load gauge
-
CPU time over time
-
average system load over time
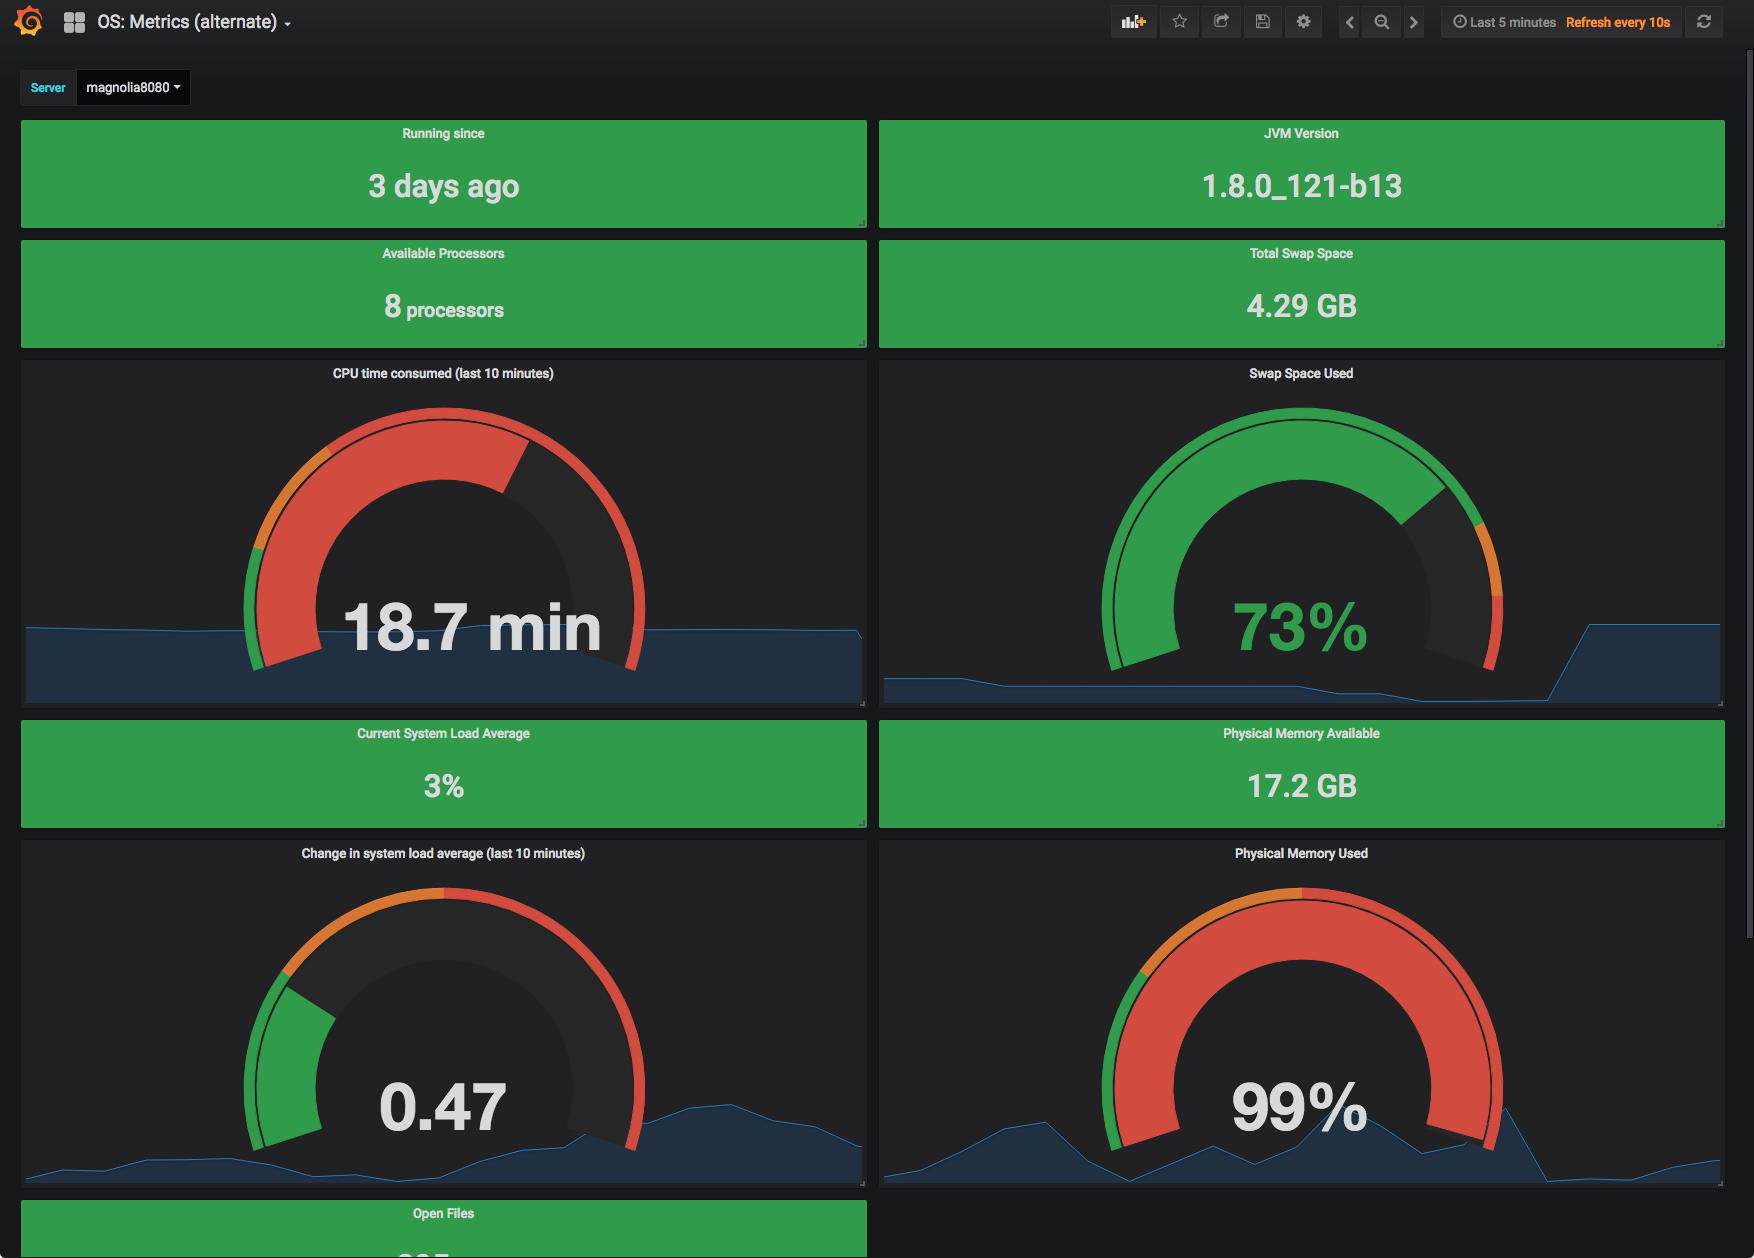
OS: Metrics (alternate)
- This dashboard
-
visualizes runtime metrics of JVM probes.
Displays details about the process running a selected Magnolia server:
-
JVM running time display
-
JVM version display
-
available processors display
-
Total OS swap space gauge
-
current average system load display
-
physical memory display
-
average system load change gauge
-
physical memory used gauge
-
current open file count display
-
open file percent gauge
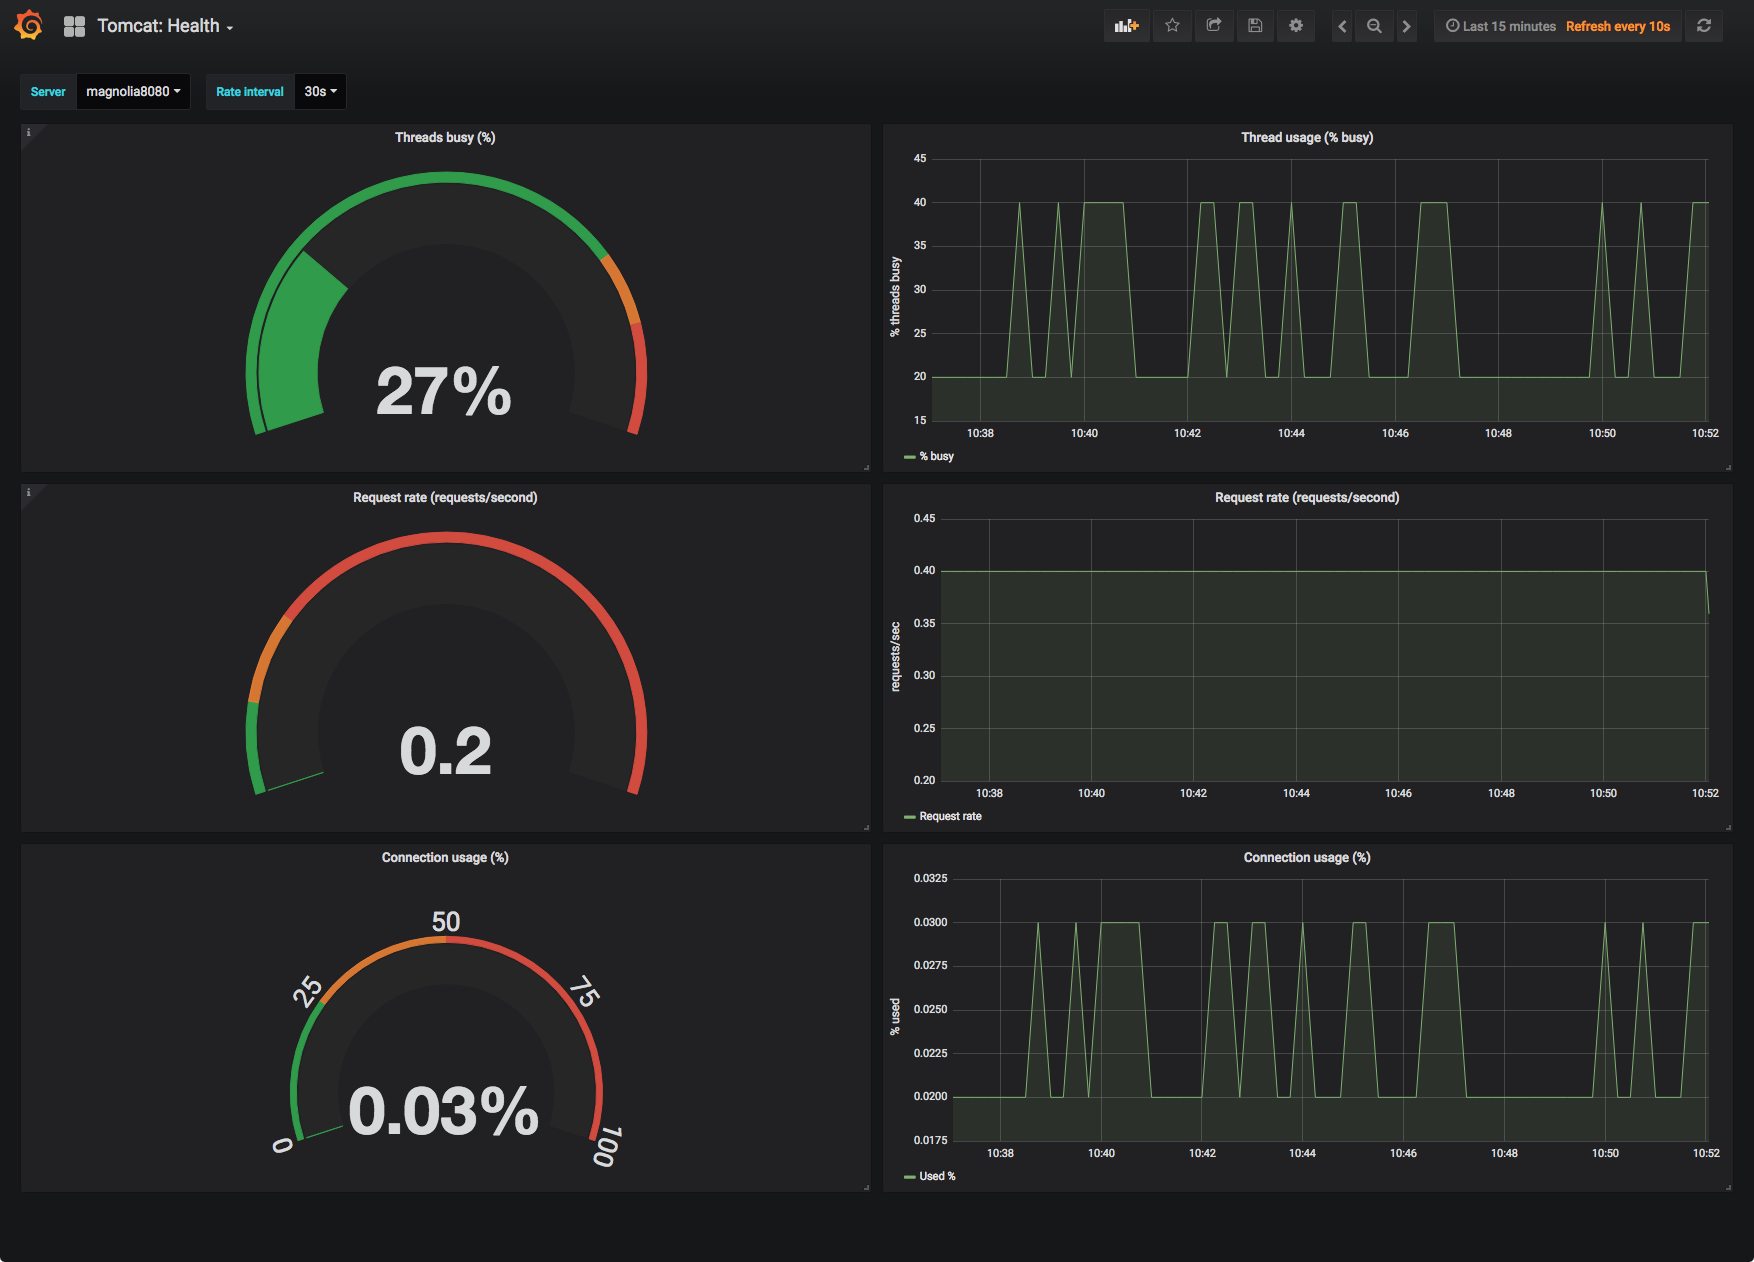
Tomcat: Health
- This dashboard
-
visualizes Tomcat metrics obtained through JMX probes.
Displays details about the Tomcat container running a selected Magnolia server:
-
used percent of threads gauge
-
used percent of threads over time
-
request rate gauge
-
request rate over time
-
used percent of connections gauge
-
used percent of connections over time