Cache probes
The cache probes can monitor usage of caches defined within Magnolia. Unlike other probes, they are not configured in the Instrumentation module, they must be configured in the Magnolia cache configuration.
The cache probes record counts of cache operations:
-
get- an item is retrieved from a cache -
put- an item is added to a cache -
clear- remove all items in a cache -
remove- remove an item from a cache
Since these operations are performed on a specific cache, the targeted cache is noted with the measurement.
The cache probes are cache listeners; they extend the AbstractCacheListener class (info.magnolia.module.cache.listeners.AbstractCacheListener) and are called when cache operations are performed.
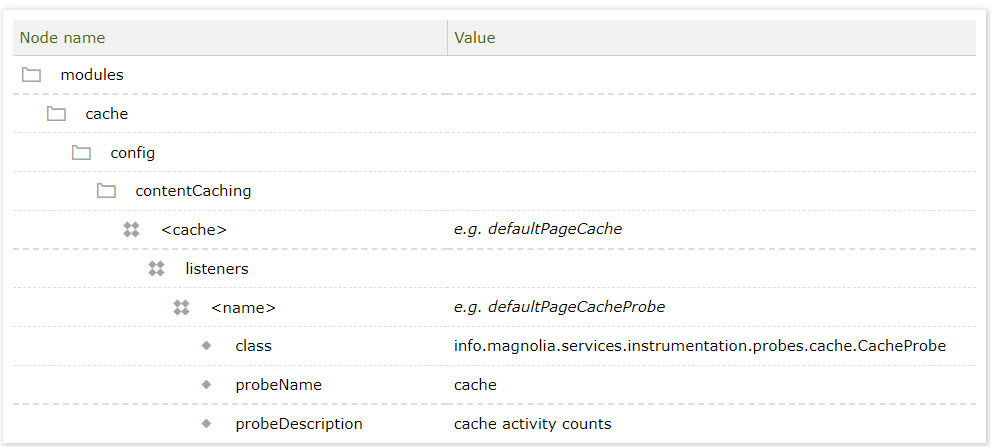
The cache probes are configured in the cache configuration: /modules/cache/config/contentCaching/<cache name>/listeners/<cache probe>.
Depending on how your cache configuration, you may or may not have to configure a cache probe for each of your configured caches:
-
if your caches extend a common cache configuration (like defaultPageCache), you can configure a cache listener in the common cache configuration and all caches extending the source cache configuration will have cache probes.
-
if you are using site aware cacheing (see Advanced Cache Policies module), you can configure a cache listener in the base cache configuration for site cacheing and all site caches will have cache probes.
-
if you want to monitor some caches but not other caches, configure cache probes in the specific caches you want to monitor. Don’t configure cache probes in base cache configurations shared by other caches. Cache probes can share a Prometheus metric name. This is useful when you have more than one cache and want cache metrics to have a common name. You can still give a specific cache probe a unique name.
Since cache probes will generate measurements with the same labels, including a label identifying the cache, it may be useful to have a metric name used by the cache probes when aggregating the cache statistics for all caches.
CacheProbe
The CacheProbe counts operations performed on a specified cache. A running count of each operation type is maintained while the probe is active.
The cache operations are:
-
"get" - an item is retrieved from the cache
-
"put" - an item is added to the cache
-
"clear" - all items are removed from the cache
-
"remove" - an item is removed from the cache
-
"get_quiet" - an item is retrieved from the cache without making a noise
Configuration properties
| Property | Description | Required | ||
|---|---|---|---|---|
|
Should be |
|||
|
The name of the cache listener.
|
|||
|
Enable or disable the collection of cache metrics for this probe. Default = |
|||
|
The metric name. |
|||
|
A description of the metric. |
Labels
| Label | Metric | Description | ||
|---|---|---|---|---|
|
<metric-name> |
The cache name. |
||
|
<metric-name> |
The cache operation. One of:app-name:
|
||
|
<metric-name> |
The cache domain or
|
||
|
<metric-name> |
The path (or key) of the cached item or
|
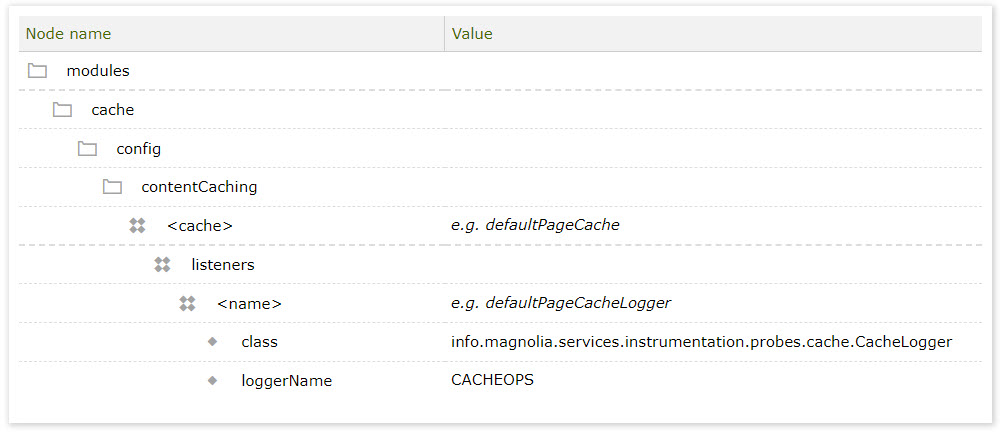
CacheLogger
Unlike other probes that report their measurements to Prometheus, the CacheLogger probe will log cache operations.
Unlike CacheProbe, CacheLogger doesn’t keep a running count of cache operations by cache, operation, domain and path; it simply logs each operation.
CacheLogger can be configured to output a log in a convenient, easy to import CSV (comma separated values) text format, that can be imported for further analysis. By default, the log message created by CacheLogger will be:
{0},{1},{2},{3},{4}where the placeholders above are:
-
0= the cache name -
1= the cache operation (get, put, clear, remove, get_quiet) -
2= the cache domain or "n/a" if unavailable or inapplicable -
3= the item cache path or "n/a" if unavailable or inapplicable
The cache operations logged are:
-
"get" - an item is retrieved from the cache
-
"put" - an item is added to the cache
-
"clear" - all items are removed from the cache
-
"remove" - an item is removed from the cache
-
"get_quiet" - an item is retrieved from the cache without making a noise
CacheLogger, because it can produce a very large number of logging messages, may not be suitable for use with very active caches since it may reduce Magnolia performance. We recommend CacheLogger and its logging configuration to set up as follows:
-
configured for only a select caches to reduce the output of logging messages
-
the cache logging messages should be directed to a separate log destination to avoid overwhelming regular Magnolia logs
-
the log destination should be controlled (limited to a set size, with a set number of backups retained) to avoid taking up excessive amounts of storage
Configuration properties
| Property | Description | Required | ||
|---|---|---|---|---|
|
Should be |
|||
|
The name of the cache listener.
|
|||
|
The name of the logger. Default = |
|||
|
An output format suitable for use with java.text.Message (see java.text.MessageFormat). The valid placeholders are:
Default
|
Log4j appender
Here’s a simple Log4j appender to capture the logging output from CacheLogger to a log file name monitor-cache.log, limited to 10 megabytes and 5 backups:
<appender name="monitor-cache" class="org.apache.log4j.RollingFileAppender">
  <param name="File" value="logs/monitor-cache.log" />
  <param name="MaxFileSize" value="10MB" />
  <param name="MaxBackupIndex" value="5" />
  <param name="Append" value="true" />
  <layout class="org.apache.log4j.PatternLayout">
    <param name="ConversionPattern" value="%d{dd.MM.yyyy HH:mm:ss},%m%n" />
  </layout>
</appender>
And here’s a Log4j category to generate the logging messages:
<category name="info.magnolia.services.instrumentation.probes.cache.CacheLogger">
  <priority value="DEBUG"/>
  <appender-ref ref="monitor-cache"/>
</category>| No metrics or labels are provided; cache activity is logged rather than collected by Prometheus. |