Machine probes
Machine probes can measure system usage metrics, including:
-
available processors
-
system load average
-
committed virtual memory size
-
total swap space size
-
free swap space size
-
JVM process CPU time used
-
free physical memory size
-
total physical memory size
-
system CPU load
-
process CPU load
-
number of open file descriptors
-
maximum number of file descriptors
With these metrics, you can get some idea how the machine that is running Magnolia is doing. These metrics depend on what JVM is running: if you are using a Hotspt-based JVM or not:
- Hotspot JVM
-
all metrics are available.
- non-Hotspot JVM
-
only available processors and system load average can be measured.
You can still configure and collect all metrics in Magnolia running on a non-Hotspot JVM, however, the measured values for non-supported metrics will be -1.
|
Collecting machine metrics
You have two options for collecting machine usage metrics:
Use OSProbe (info.magnolia.services.instrumentation.probes.environment.OSProbe) to collect machine metrics. OSProbe will create separate metrics for each system usage characteristic. OSProbe is configured as an instrumentation module probe and the metrics will be measured when Prometheus collects all metrics from Magnolia.
Use OSProbeCommand (info.magnolia.services.instrumentation.probes.commands.OSProbeCommand) to collect metrics. OSProbeCommand is a Magnolia command that collects the configured metrics when executed. Executions of OSProbeCommand can be scheduled with the Scheduler Module. You can also execute the OSProbeCommand through the command REST endpoint, see the REST module. OSProbeCommand will store its measurements as a single metric with the metric labels identifying what was measured.
- Use OSProbeCommand when
-
-
you want to measure machine more frequently or less frequently than the collection of metrics from Magnolia
-
you want a single metric for all measurements
-
you want to invoke the collection of machine metrics remotely
-
- Use OSProbe when
-
-
you want separate metrics for each machine attribute
-
OSProbe
The OSProbe records how the machine running Magnolia is being used: system load, memory and swap usage and file usage.
OSProbe is an instrumentation module probe and is configured in the instrumentation module.
Configuration properties
| Property | Description | Required | ||||
|---|---|---|---|---|---|---|
|
Should be |
|||||
|
The probe name.
|
|||||
|
A list of metric names (info.magnolia.services.instrumentation.probes.environment.OSMetricName) to collect.
The valid metric names are:
|
Metrics
| Metric | Description | ||
|---|---|---|---|
|
The number of processors available to the Java virtual machine. |
||
|
The system load average for the last minute. The system load average is the sum of the number of runnable entities queued to the available processors and the number of runnable entities running on the available processors averaged over a period of time. The way in which the load average is calculated is operating system specific but is typically a damped time-dependent average. If the load average is not available, the metric value is -1.
|
||
|
The amount of virtual memory that is guaranteed to be available to the running process in bytes, or -1 if this metric is not supported. |
||
|
The total amount of swap space in byte, or -1 if this metric is not supported. |
||
|
The amount of free swap space in bytes, or -1 if this metric is not supported. |
||
|
The "recent cpu usage" for the Java Virtual Machine process. This value is a double in the [0.0,1.0] interval. A value of 0.0 means that none of the CPUs were running threads from the JVM process during the recent period of time observed, while a value of 1.0 means that all CPUs were actively running threads from the JVM 100% of the time during the recent period being observed. Threads from the JVM include the application threads as well as the JVM internal threads. All values betweens 0.0 and 1.0 are possible depending of the activities going on in the JVM process and the whole system.
|
||
|
The amount of free physical memory in bytes, or -1 if this metric is not supported. |
||
|
The total amount of physical memory in bytes, or -1 if this metric is not supported. |
||
|
The "recent cpu usage" for the whole system. This value is a double in the [0.0,1.0] interval. A value of 0.0 means that all CPUs were idle during the recent period of time observed, while a value of 1.0 means that all CPUs were actively running 100% of the time during the recent period being observed. All values betweens 0.0 and 1.0 are possible depending of the activities going on in the system.
|
||
|
The "recent cpu usage" for the Java Virtual Machine process. This value is a double in the [0.0,1.0] interval. A value of 0.0 means that none of the CPUs were running threads from the JVM process during the recent period of time observed, while a value of 1.0 means that all CPUs were actively running threads from the JVM 100% of the time during the recent period being observed. Threads from the JVM include the application threads as well as the JVM internal threads. All values betweens 0.0 and 1.0 are possible depending of the activities going on in the JVM process and the whole system.
|
||
|
The number of open file descriptors, or -1 if the metric is not supported. |
||
|
The maximum number of file descriptors, or -1 if the metric is not supported. |
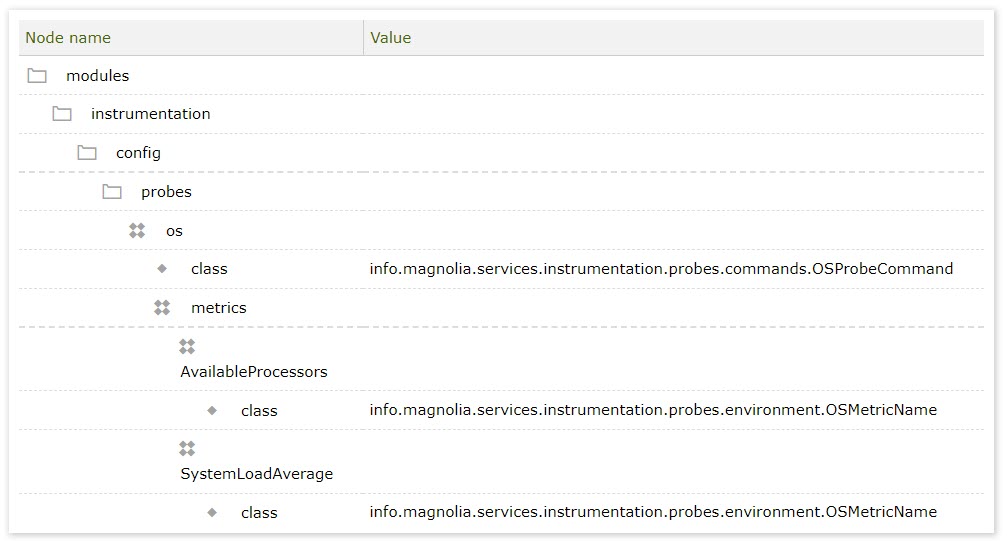
OSProbeCommand
The OSProbeCommand records how the machine running Magnolia is being used: system load, memory and swap usage and file usage.
Unlike other probes, OSProveCommand is a Magnolia command. OSProbeCommand only measures its metrics when executed as a command. You will have to arrange for the execution of OSProbeCommand in order to measure its metrics, say with the Scheduler module or the REST command endpoint.
The OSProbeCommand properties metrics, probeName and probeDescription can be specified in the command parameters passed during execution and will override the configured values of the properties.
| See Commands for more on Magnolia commands. |
Configuration properties
| Property | Description | Required | ||||
|---|---|---|---|---|---|---|
|
Should be |
|||||
|
The probe name.
|
|||||
|
A list of metric names (info.magnolia.services.instrumentation.probes.environment.OSMetricName) to collect.
The valid metric names are:
|
Labels
In addition to the common labels instance and job, the following labels are available:
| Label | Metric | Description |
|---|---|---|
|
|
The metric name, one of
|
Metrics
| Metric | Description | ||
|---|---|---|---|
|
The number of processors available to the Java virtual machine. |
||
|
The system load average for the last minute. The system load average is the sum of the number of runnable entities queued to the available processors and the number of runnable entities running on the available processors averaged over a period of time. The way in which the load average is calculated is operating system specific but is typically a damped time-dependent average. If the load average is not available, the metric value is -1.
|
||
|
The amount of virtual memory that is guaranteed to be available to the running process in bytes, or -1 if this metric is not supported. |
||
|
The total amount of swap space in byte, or -1 if this metric is not supported. |
||
|
The amount of free swap space in bytes, or -1 if this metric is not supported. |
||
|
The "recent cpu usage" for the Java Virtual Machine process. This value is a double in the [0.0,1.0] interval. A value of 0.0 means that none of the CPUs were running threads from the JVM process during the recent period of time observed, while a value of 1.0 means that all CPUs were actively running threads from the JVM 100% of the time during the recent period being observed. Threads from the JVM include the application threads as well as the JVM internal threads. All values betweens 0.0 and 1.0 are possible depending of the activities going on in the JVM process and the whole system.
|
||
|
The amount of free physical memory in bytes, or -1 if this metric is not supported. |
||
|
The total amount of physical memory in bytes, or -1 if this metric is not supported. |
||
|
The "recent cpu usage" for the whole system. This value is a double in the [0.0,1.0] interval. A value of 0.0 means that all CPUs were idle during the recent period of time observed, while a value of 1.0 means that all CPUs were actively running 100% of the time during the recent period being observed. All values betweens 0.0 and 1.0 are possible depending of the activities going on in the system.
|
||
|
The "recent cpu usage" for the Java Virtual Machine process. This value is a double in the [0.0,1.0] interval. A value of 0.0 means that none of the CPUs were running threads from the JVM process during the recent period of time observed, while a value of 1.0 means that all CPUs were actively running threads from the JVM 100% of the time during the recent period being observed. Threads from the JVM include the application threads as well as the JVM internal threads. All values betweens 0.0 and 1.0 are possible depending of the activities going on in the JVM process and the whole system.
|
||
|
The number of open file descriptors, or -1 if the metric is not supported. |
||
|
The maximum number of file descriptors, or -1 if the metric is not supported. |