Logs
The DX Cloud Logs section in the Cockpit displays logs for pods, domains, ingresses, and more. Each section has dedicated filtering by their relevant components as well as by a date range.
There are several different types of logs which are covered on this page. See the subsections below more for more details.
Select desired cluster
Select your desired cluster from the dropdown menu at the top of the Cockpit.

Magnolia Backend logs
Magnolia Backend displays log information from Kubernetes Pods associated with the Magnolia backend. You can access the pods logs by going to your Cockpit and navigating to the Logs section.
Generally, we keep logs for 30 days. However, for your deployment, you may configure a different duration.
|
You can select up to the last 7 days for this filter. |
Instructions
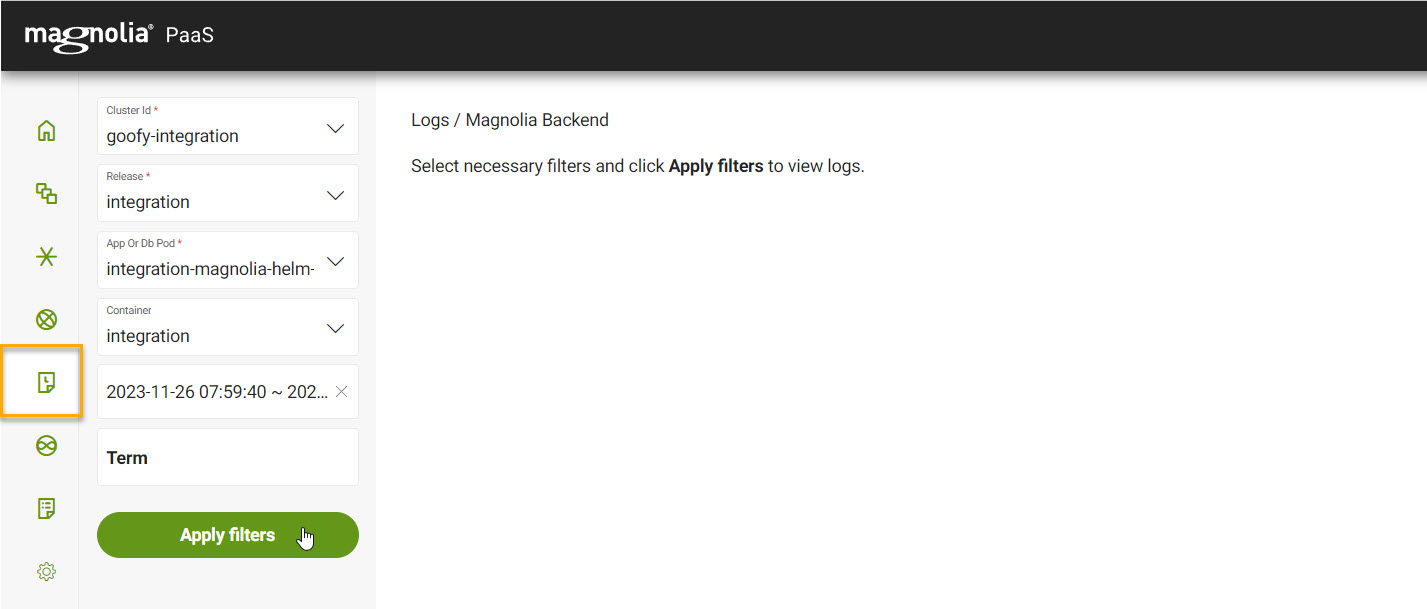
From Logs > Magnolia Backend:
View from the Cockpit
-
First, select your desired cluster.
-
Select your desired Release from the dropdown list.
-
Select your desired App or Database pod from the dropdown list.
-
Select your desired Container from the dropdown list.
-
Select your desired Date Range.
-
Input any filter terms under Term. This filters the results by the term you’ve entered.
-
Click Apply filters.
Filter selection persists
Magnolia Frontend logs
Magnolia Frontend displays log information from Kubernetes Pods associated with the Magnolia frontend. You can access the pods logs by going to your Cockpit and navigating to the Logs section.
Generally, we keep logs for 30 days. However, for your deployment, you may configure a different duration.
|
You can select up to the last 7 days for this filter. |
Instructions
From Logs > Magnolia Frontend:
-
First, select your desired cluster.
-
Select your desired Release from the dropdown list.
-
Select your desired Frontend pod from the dropdown list.
-
Select your desired Frontend component from the dropdown list.
This is typically the public or author instance.
-
Select your desired Date Range.
-
Input any filter terms under Term. This filters the results by the term you’ve entered.
-
Click Apply filters.
Filter selection persists
Fastly domain logs
DX Cloud stores Fastly cache logs. The default setup and deployment stores customer IPs for a configurable amount of time. However, if you do not want customer IPs included in the logs at all, this is also something that can be configured.
Generally, we keep logs for 30 days. However, for your deployment, you may configure a different duration.
|
You can select up to the last 7 days for this filter. |
Instructions
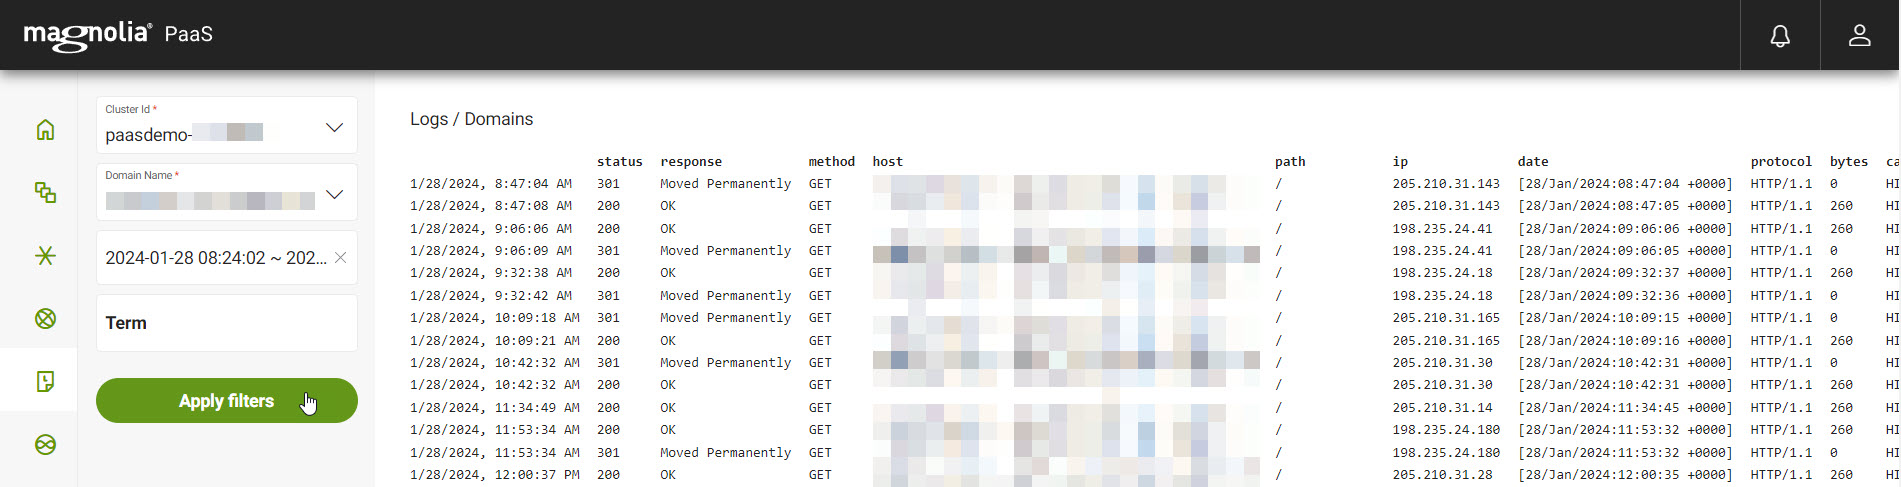
From Logs > Domains:
View from the Cockpit
-
First, select your desired cluster.
-
Select your desired Domain name.
-
Select your desired Date range.
-
If desired, enter a term to filter on.
-
Click Apply filters.
WAF logs
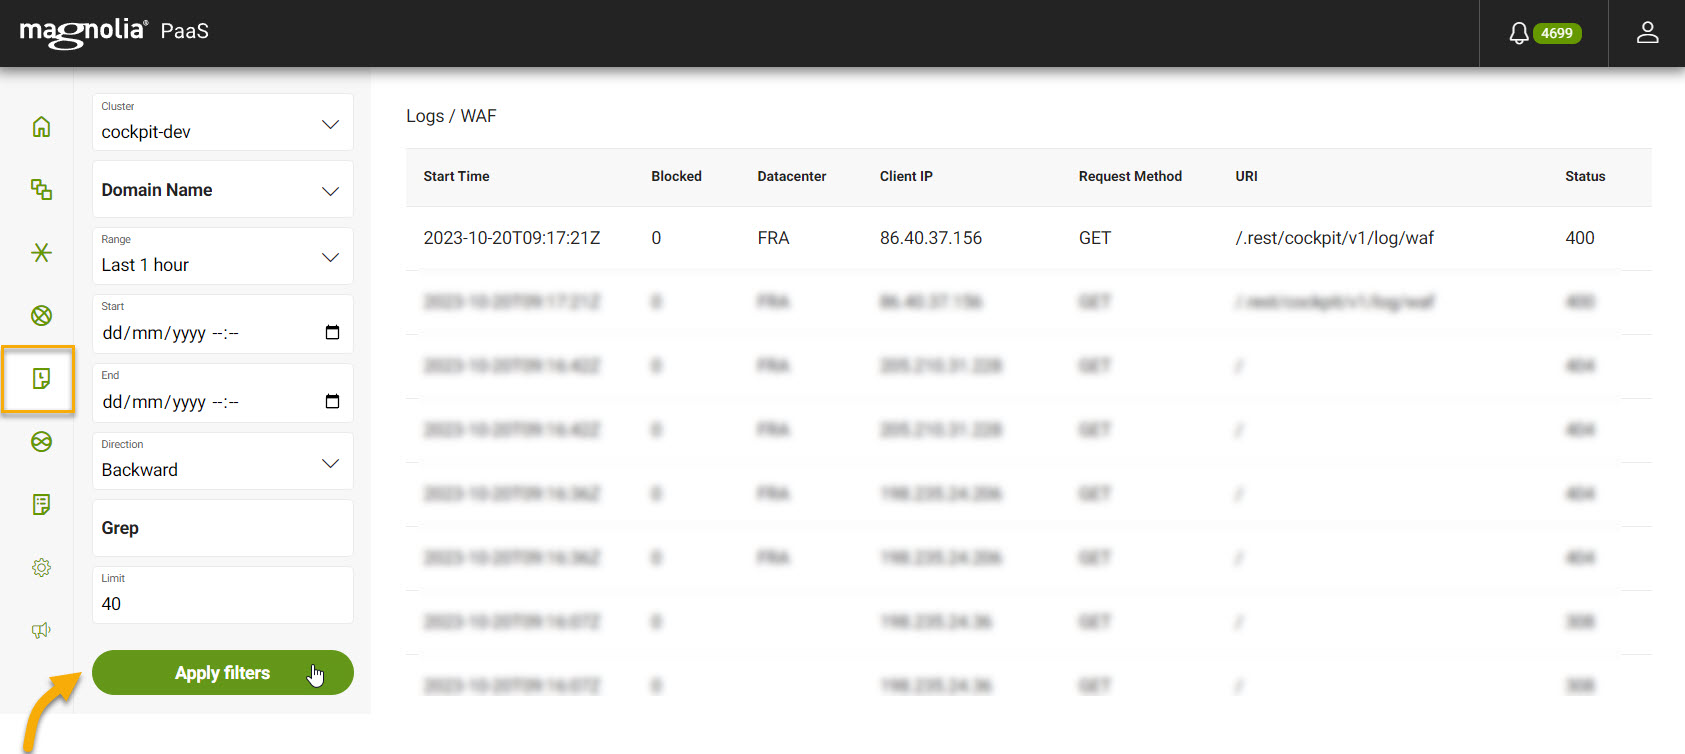
WAF logs displays log information from your Web Application Firewall rules. It only displays requests that have been blocked. You can access the WAF logs by going to your Cockpit and navigating to the Logs section.
Generally, we keep logs for 30 days. However, for your deployment, you may configure a different duration.
|
You can select up to the last 7 days for this filter. |
Instructions
From Logs > WAF:
View from the Cockpit
-
First, select your desired cluster.
-
Select your desired Domain name from the dropdown list.
-
Select your desired Date range.
-
If desired, enter a term to filter on.
-
Click Apply filters.
Filter selection persists
Kubernetes ingress logs
Kubernetes ingress logs displays log information from Kubernetes ingresses. You can access the Ingress logs by going to your Cockpit and navigating to the Logs section.
Generally, we keep logs for 30 days. However, for your deployment, you may configure a different duration.
|
You can select up to the last 7 days for this filter. |
Instructions
From Logs > Ingresses:
-
First, select your desired cluster.
-
Select your desired Service from the dropdown list.
-
Select your desired Date range.
-
If desired, enter a term to filter on.
-
Click Apply filters.
Filter selection persists
Log format
6/6/2024, 4:18:46 PM 157.52.67.55 - - [10/Jun/2024:15:18:46 +0000] "GET /.rest/cockpit/v1/cluster/statistics?clusterId=c-r5veq&serviceName=GET_RANCHER_CLUSTER_PROVIDER&timeBased=false HTTP/1.1" 200 34 "https://cockpit.customer.magnolia-platform.com/cockpit/v1/cluster/statistics?clusterId=c-r5veq&" "Mozilla/5.0 (Macintosh; Intel Mac OS X 10_15_7) AppleWebKit/537.36 (KHTML, like Gecko) Chrome/125.0.0.0 Safari/537.36" 3720 0.041 [prod-prod-magnolia-helm-public-svc-http] [] 10.41.3.131:8080 34 0.041 200 9c3rf24w1od91491313735979dc22bj9| Description | Sample value | |
|---|---|---|
1 |
Log entry timestamp |
|
2 |
Client IP address |
|
3 |
Client identity and authenticated user (unused) |
|
4 |
Request timestamp |
|
5 |
HTTP request method, URL, and version |
|
6 |
HTTP status code |
|
7 |
Response size in bytes |
|
8 |
Referrer URL |
|
9 |
User-agent string |
|
10 |
Total request time in milliseconds |
|
11 |
Backend connection time in seconds |
|
12 |
Backend service name |
|
13 |
Additional info/annotations (empty) |
|
14 |
Backend server IP address and port |
|
15 |
Response size in bytes (repeated) |
|
16 |
Backend processing time in seconds (repeated) |
|
17 |
HTTP status code (repeated) |
|
18 |
Unique request identifier |
|
Enterprise search logs
DX Cloud stores Enterprise search logs. You can access the logs by going to your Cockpit and navigating to the Logs section. Enterprise search logs store a range of information from application errors to slow queries.
Generally, we keep logs for 30 days. However, for your deployment, you may configure a different duration.
|
You can select up to the last 7 days for this filter. |
Instructions
From Logs > Enterprise search:
-
First, select your desired cluster.
-
Select your desired Release from the dropdown list.
-
Select your desired Date range.
-
Click Apply filters.
Filter selection persists
| For more information on what you can see in these particular logs, see Solr logging. |
Event logs
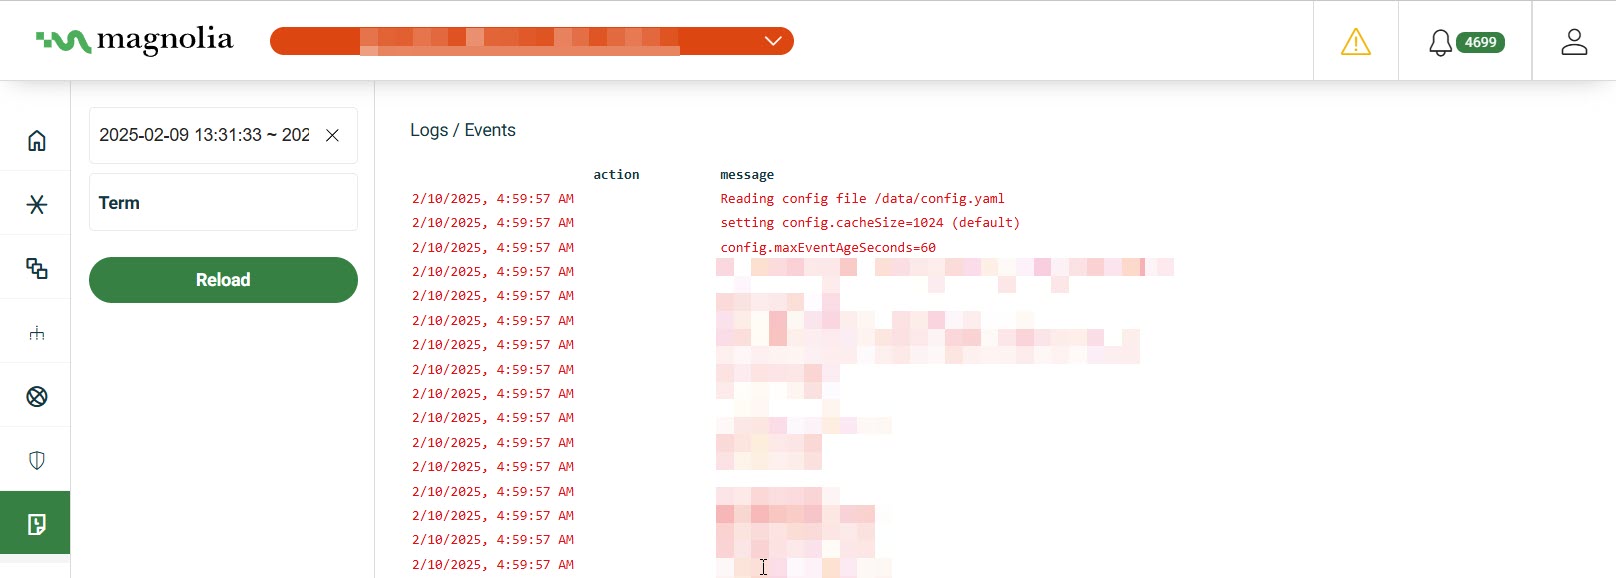
The Events section in the Cockpit displays information about the events within the cluster. These events are objects that show you exactly what is occurring inside your cluster, such as scheduler decisions or why some pods are being evicted from a node.
Generally, we keep logs for 30 days. However, for your deployment, you may configure a different duration.
|
You can select up to the last 7 days for this filter. |
Instructions
From Logs > Events:
View from the Cockpit
-
First, select your desired cluster.
-
Select the Start and End date range.
-
If desired, enter a term to filter on.
-
Click Apply filters.
Filter selection persists