Reports
|
The Reports feature is temporarily unavailable due to maintenance to improve the feature. The feature may still be visible on the Cockpit for some users, but it is currently not functioning as expected. Please bear with us while we work hard to improve DX Cloud for you. |
The DX Cloud Reports section contains important information about your deployment’s SLAs.
| The thresholds defined for SLAs may vary from customer to customer. |
Uptime
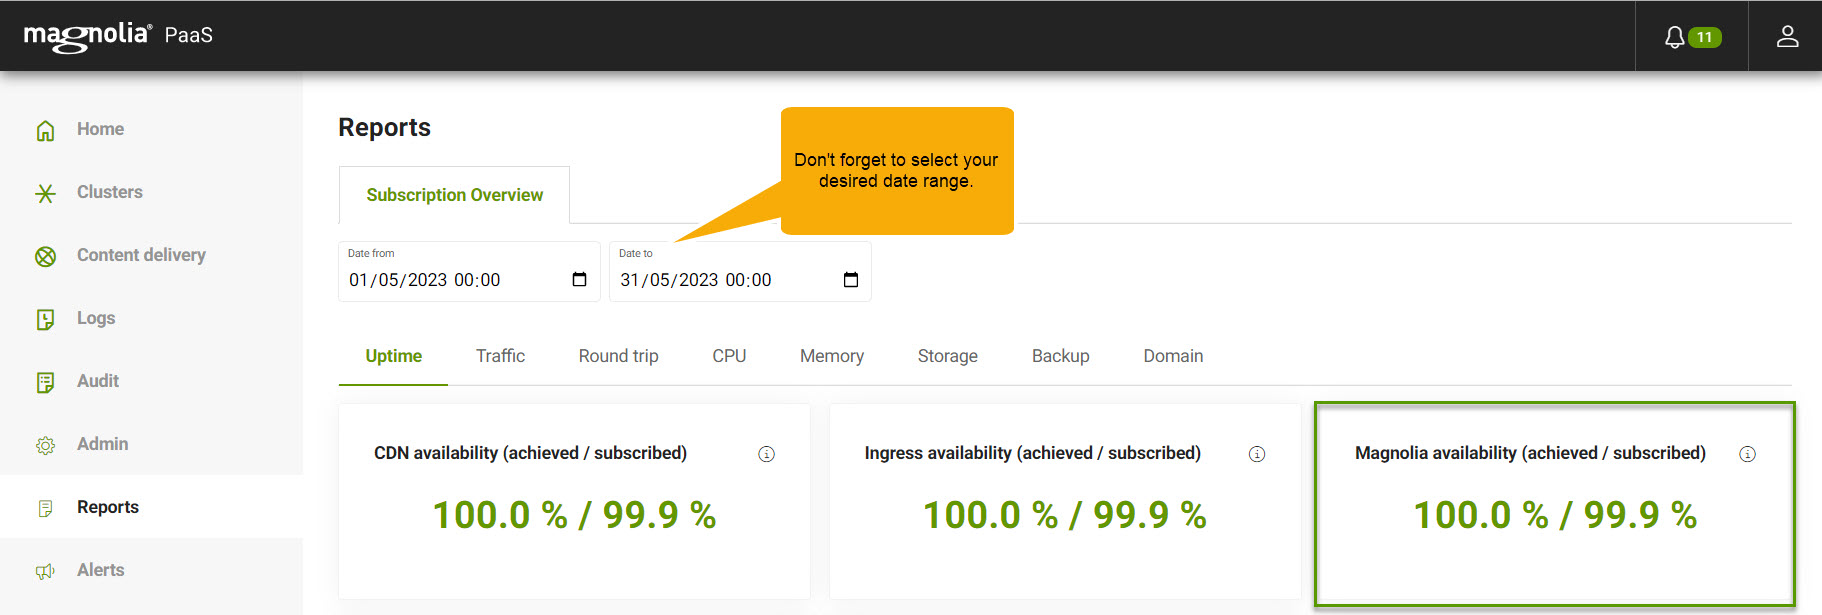
Uptime is the measurement of your DX Cloud website’s availability to your end users. This is calculated by (total availability of the site * 100)/time = uptime. Currently, you can view the uptime for your CDN, Ingresses, and Magnolia itself.
At the CDN level, the percentage of HTTP requests failed with a 502 (Bad Gateway) or 503 (Service Unavailable) compared to the total number of requests.
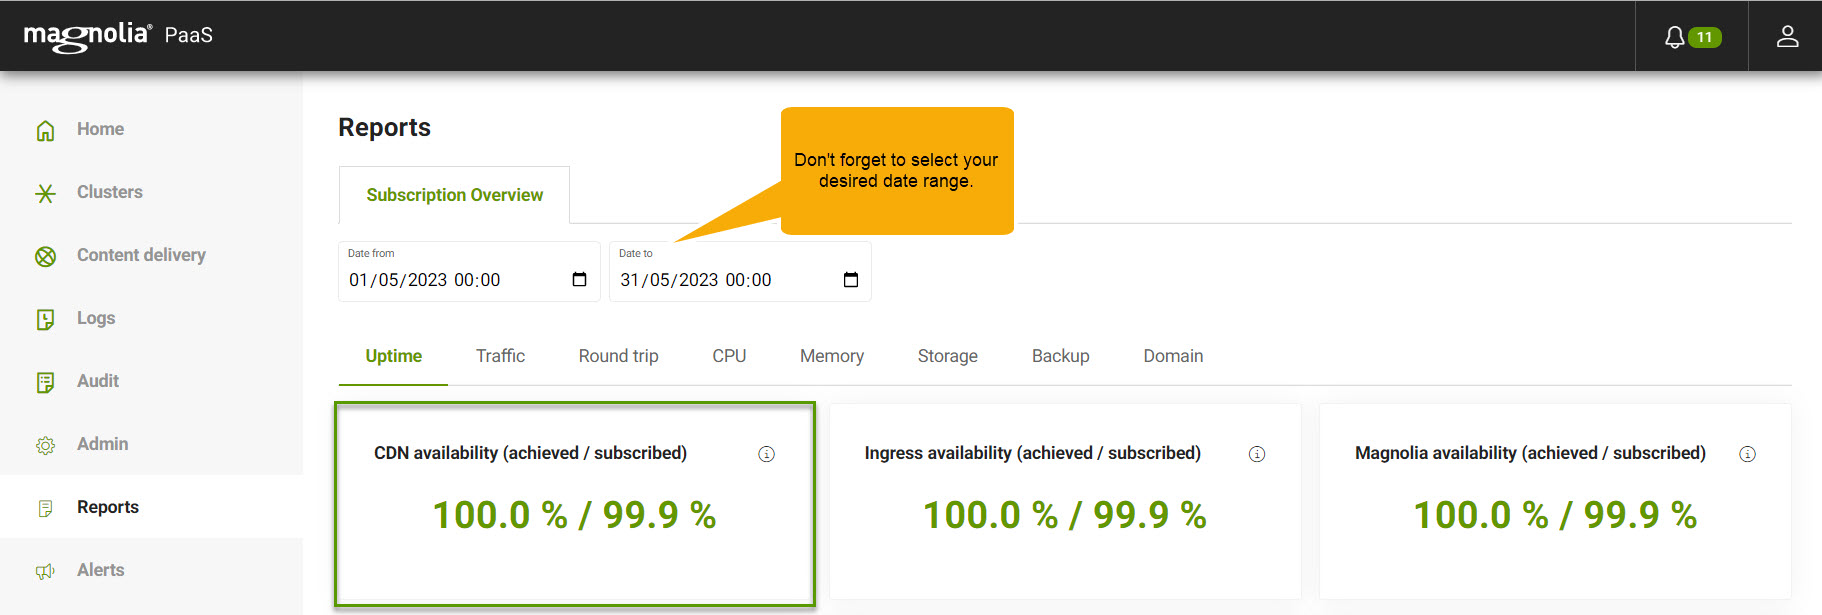
At the Ingress level, the percentage of HTTP requests failed with a 502 (Bad Gateway) or 503 (Service Unavailable) compared to the total number of requests.
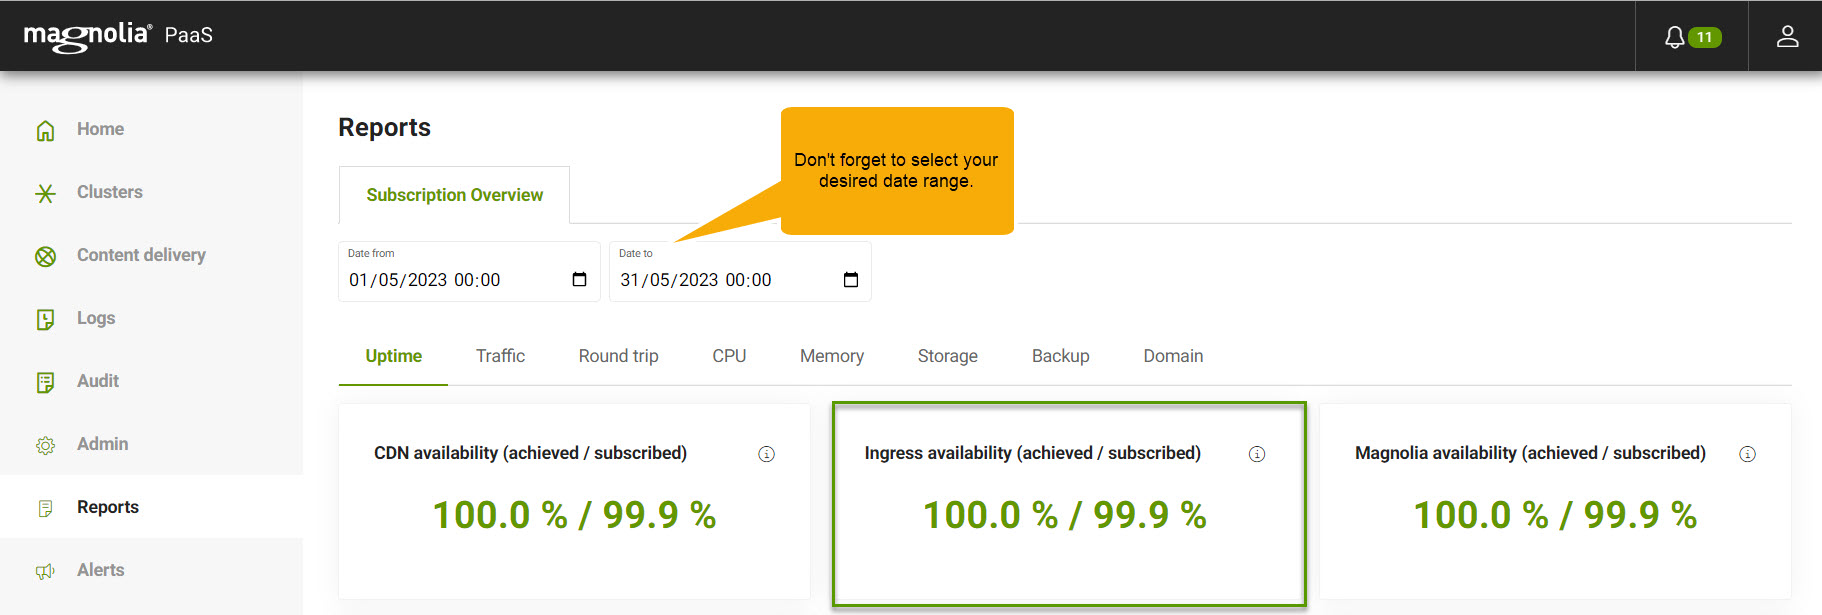
At the Magnolia level, the percentage of HTTP requests failed with a 502 (Bad Gateway) or 503 (Service Unavailable) compared to the total number of requests.
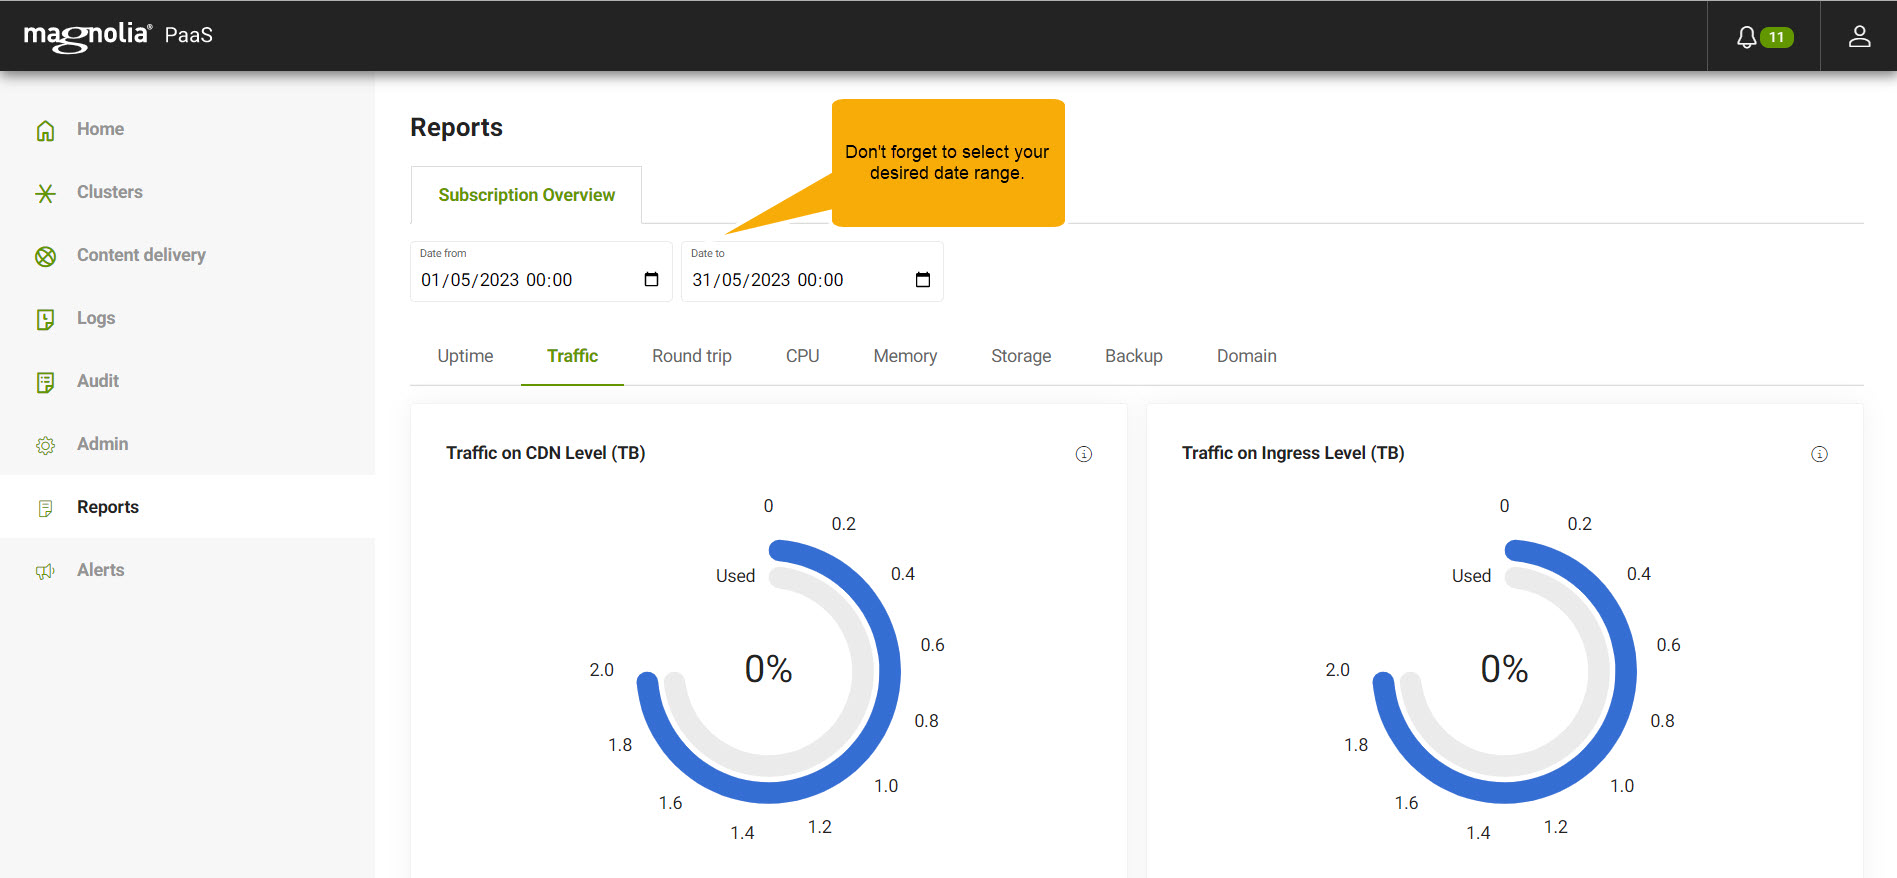
Traffic
The Traffic subtab displays the sum of the bytes sent for all HTTP requests for both the CDN and Ingress level.
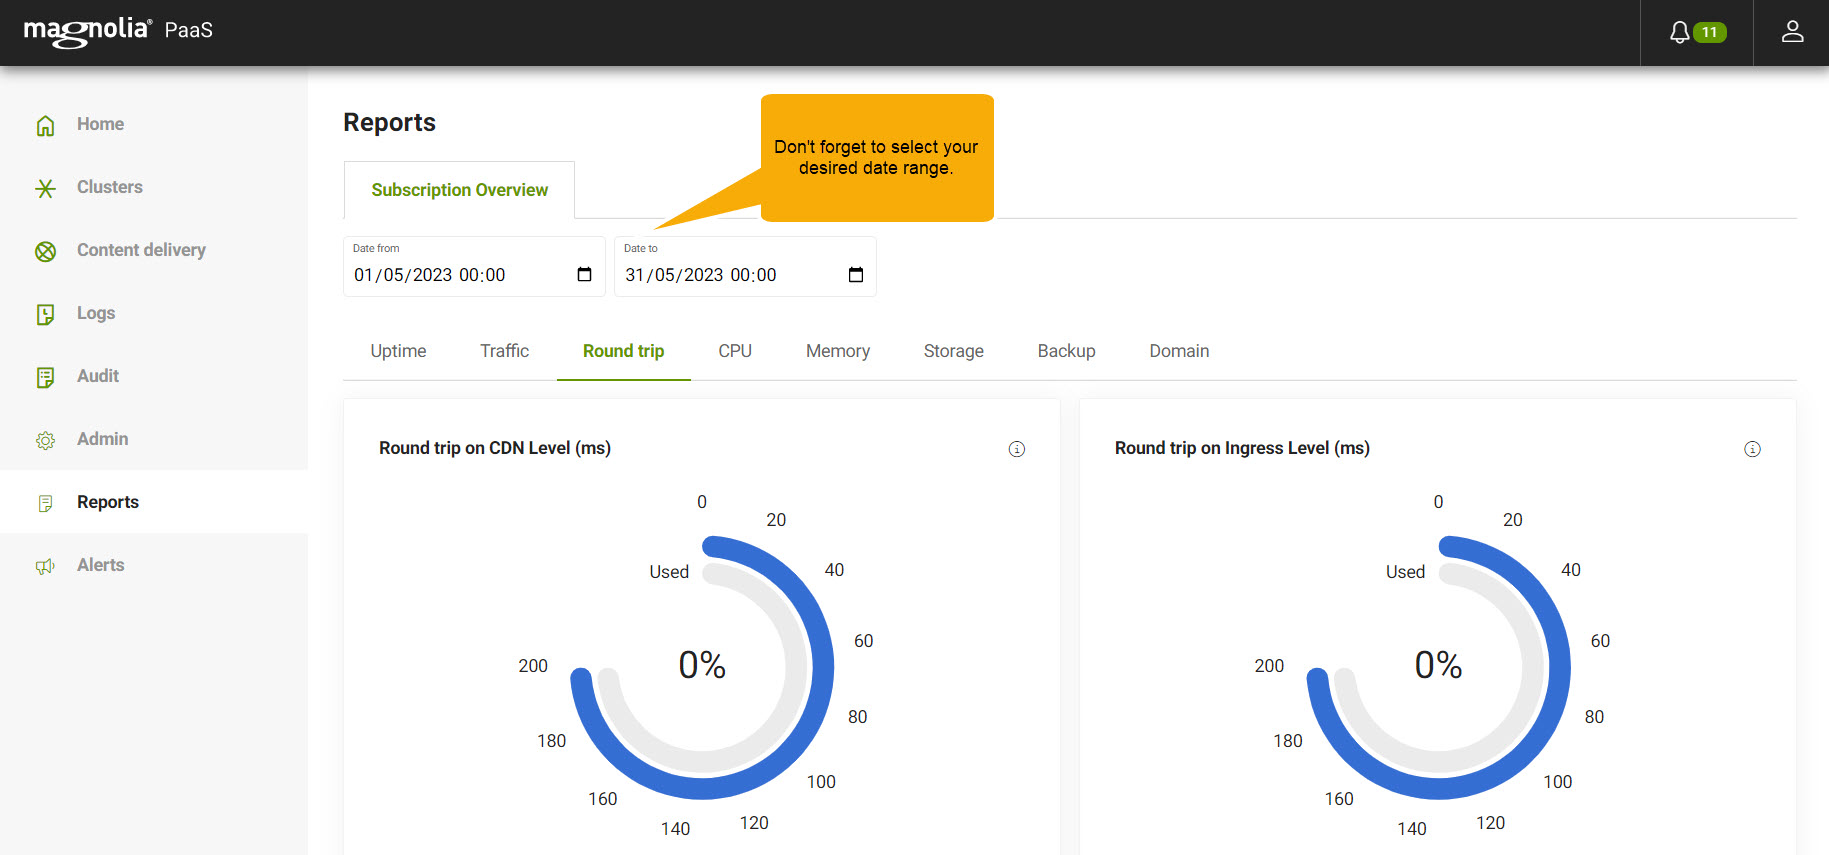
Round trip
The Round trip subtab displays the average (in milliseconds) of the round trip for all HTTP requests for both the CDN and Ingress level.
CPU
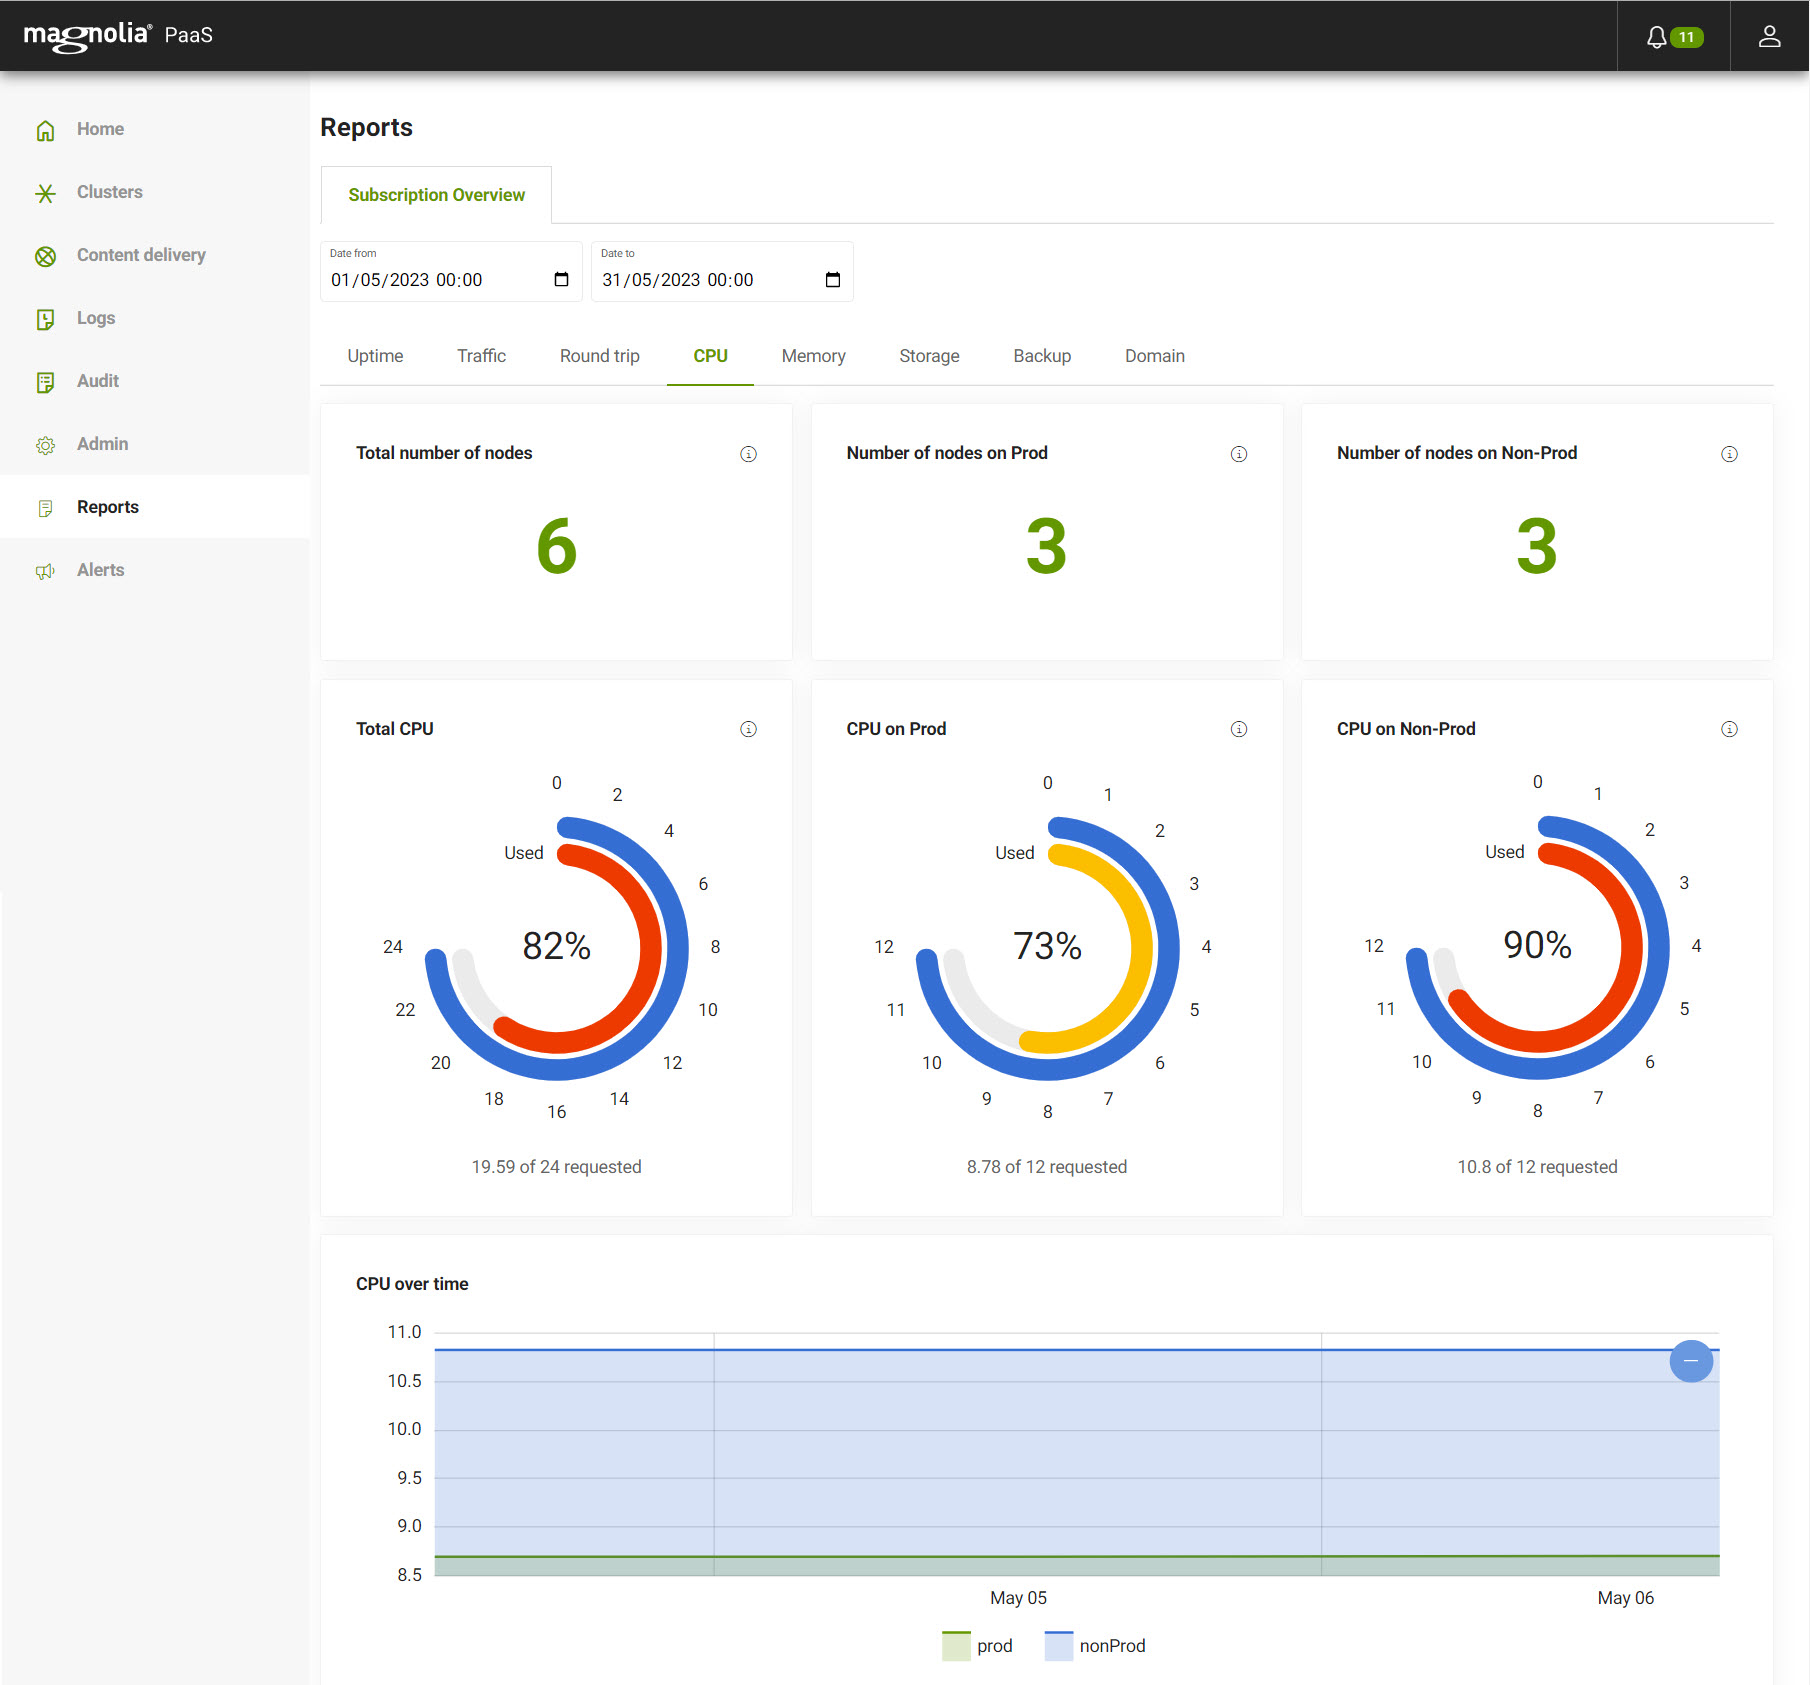
The CPU subtab displays several items:
-
Total nodes
-
Production nodes
-
Non-production nodes
-
Total CPU
-
CPU on Production
-
CPU on Non-production
-
CPU over time
The CPU over time graph allows you to select a more specific part of the already selected range. You can do this by hovering over the chart and clicking the area you want to analyze more closely.
View from the Cockpit
Memory
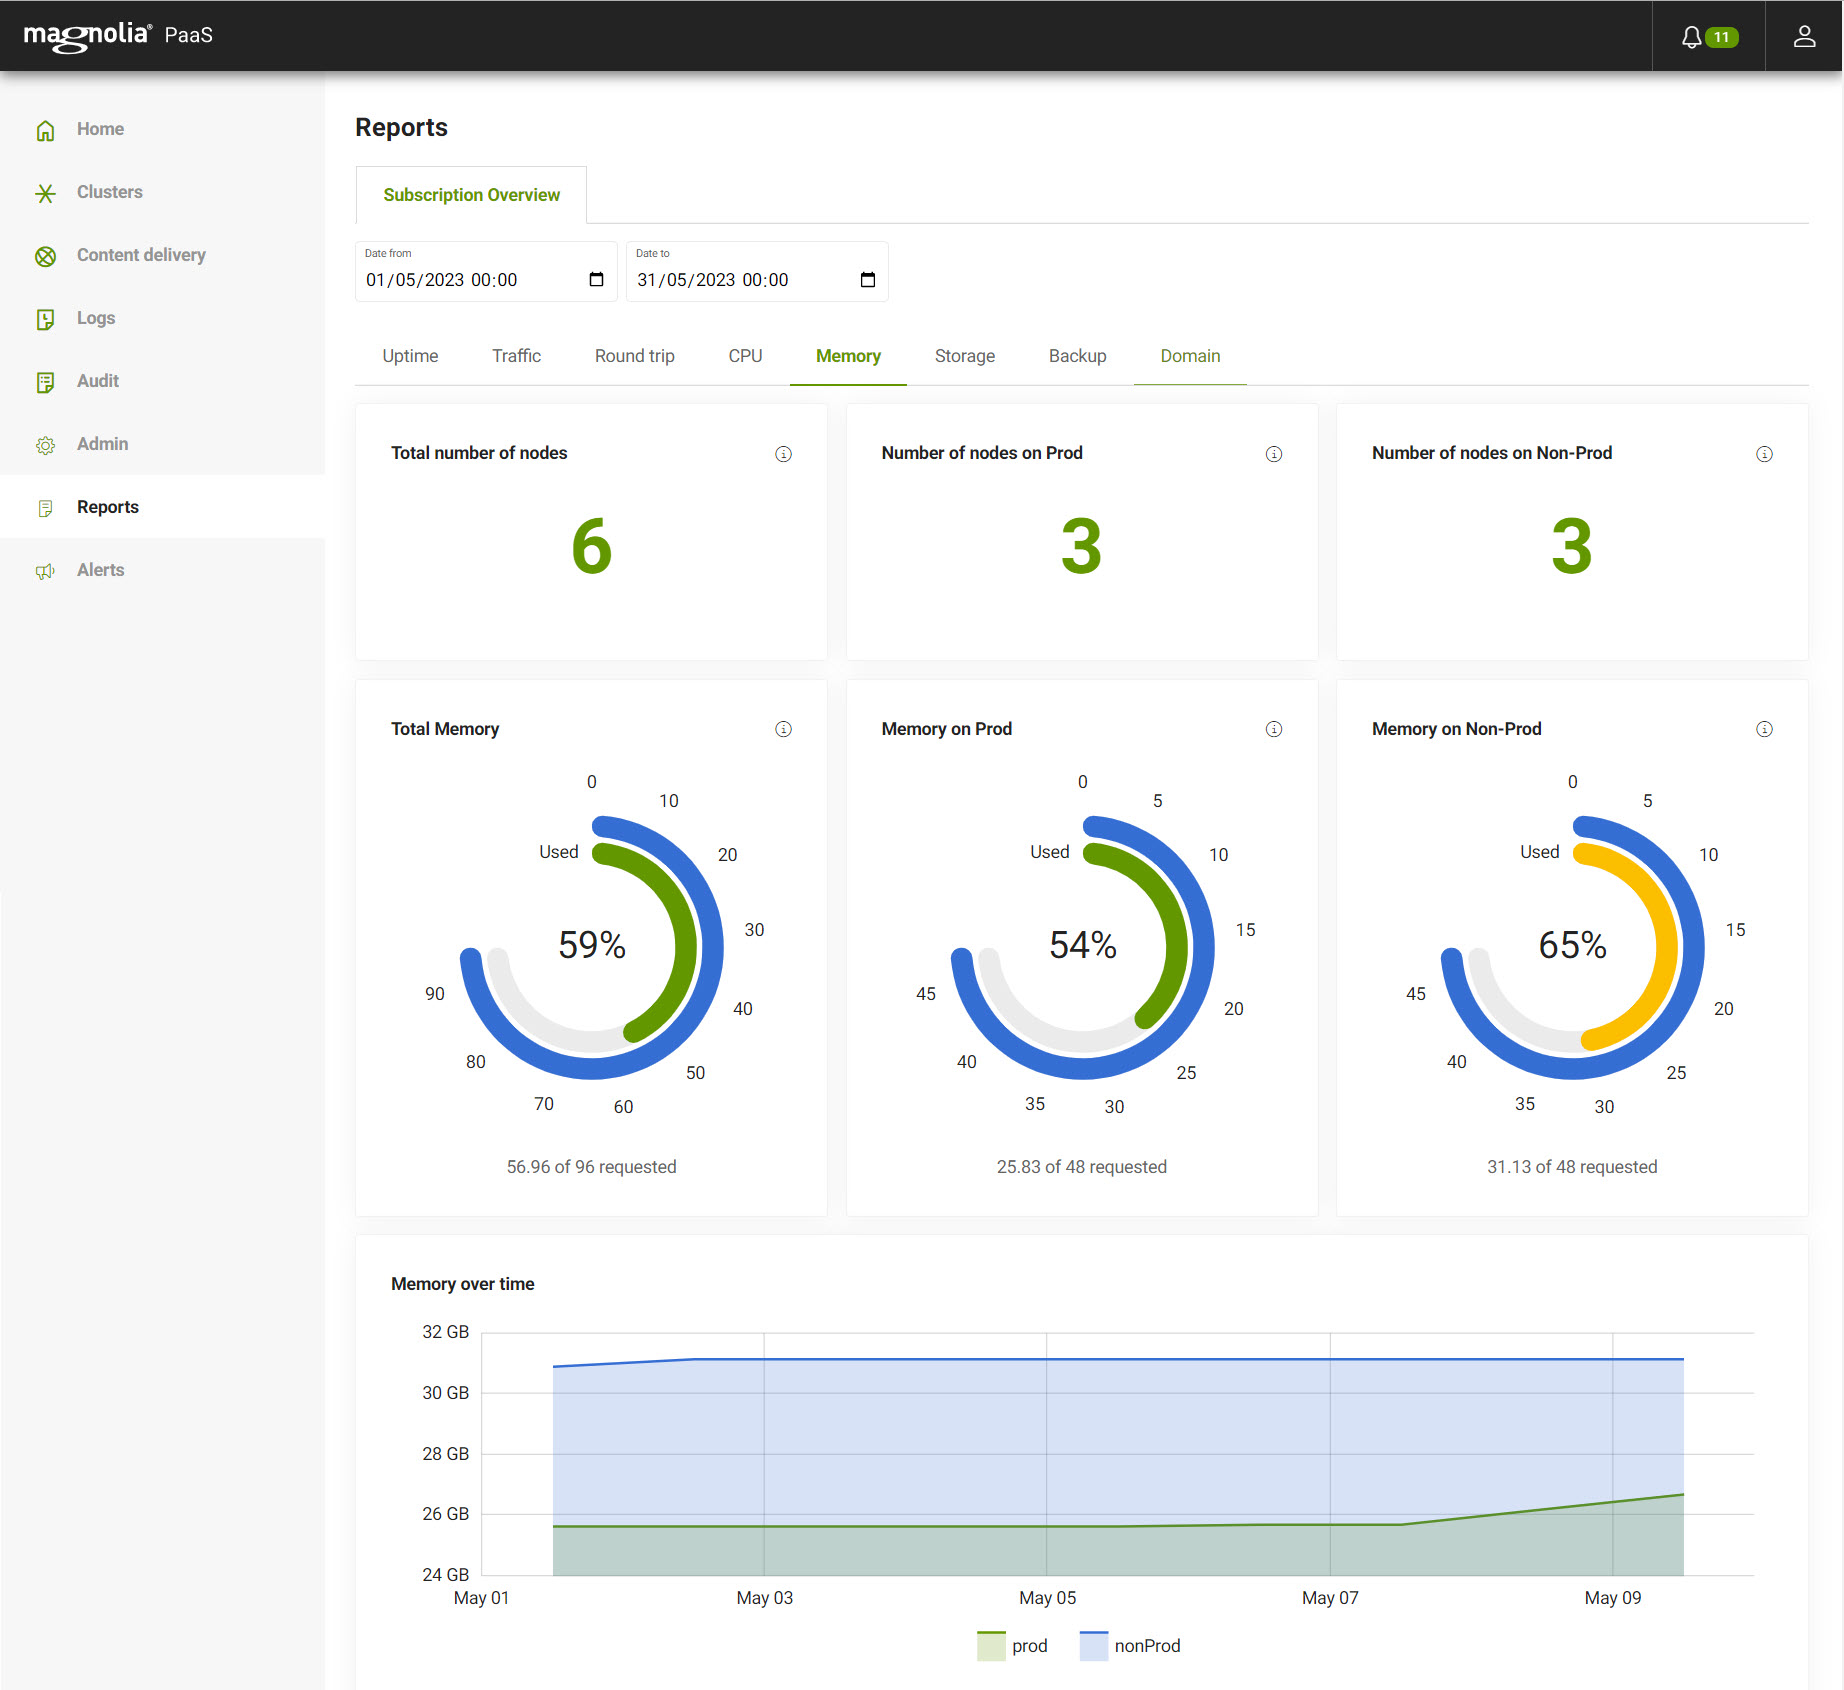
The Memory subtab displays several items:
-
Total nodes
-
Production nodes
-
Non-production nodes
-
Total Memory
-
Memory on Production
-
Memory on Non-production
-
Memory over time
The Memory over time graph allows you to select a more specific part of the already selected range. You can do this by hovering over the chart and clicking the area you want to analyze more closely.
View from the Cockpit
Storage
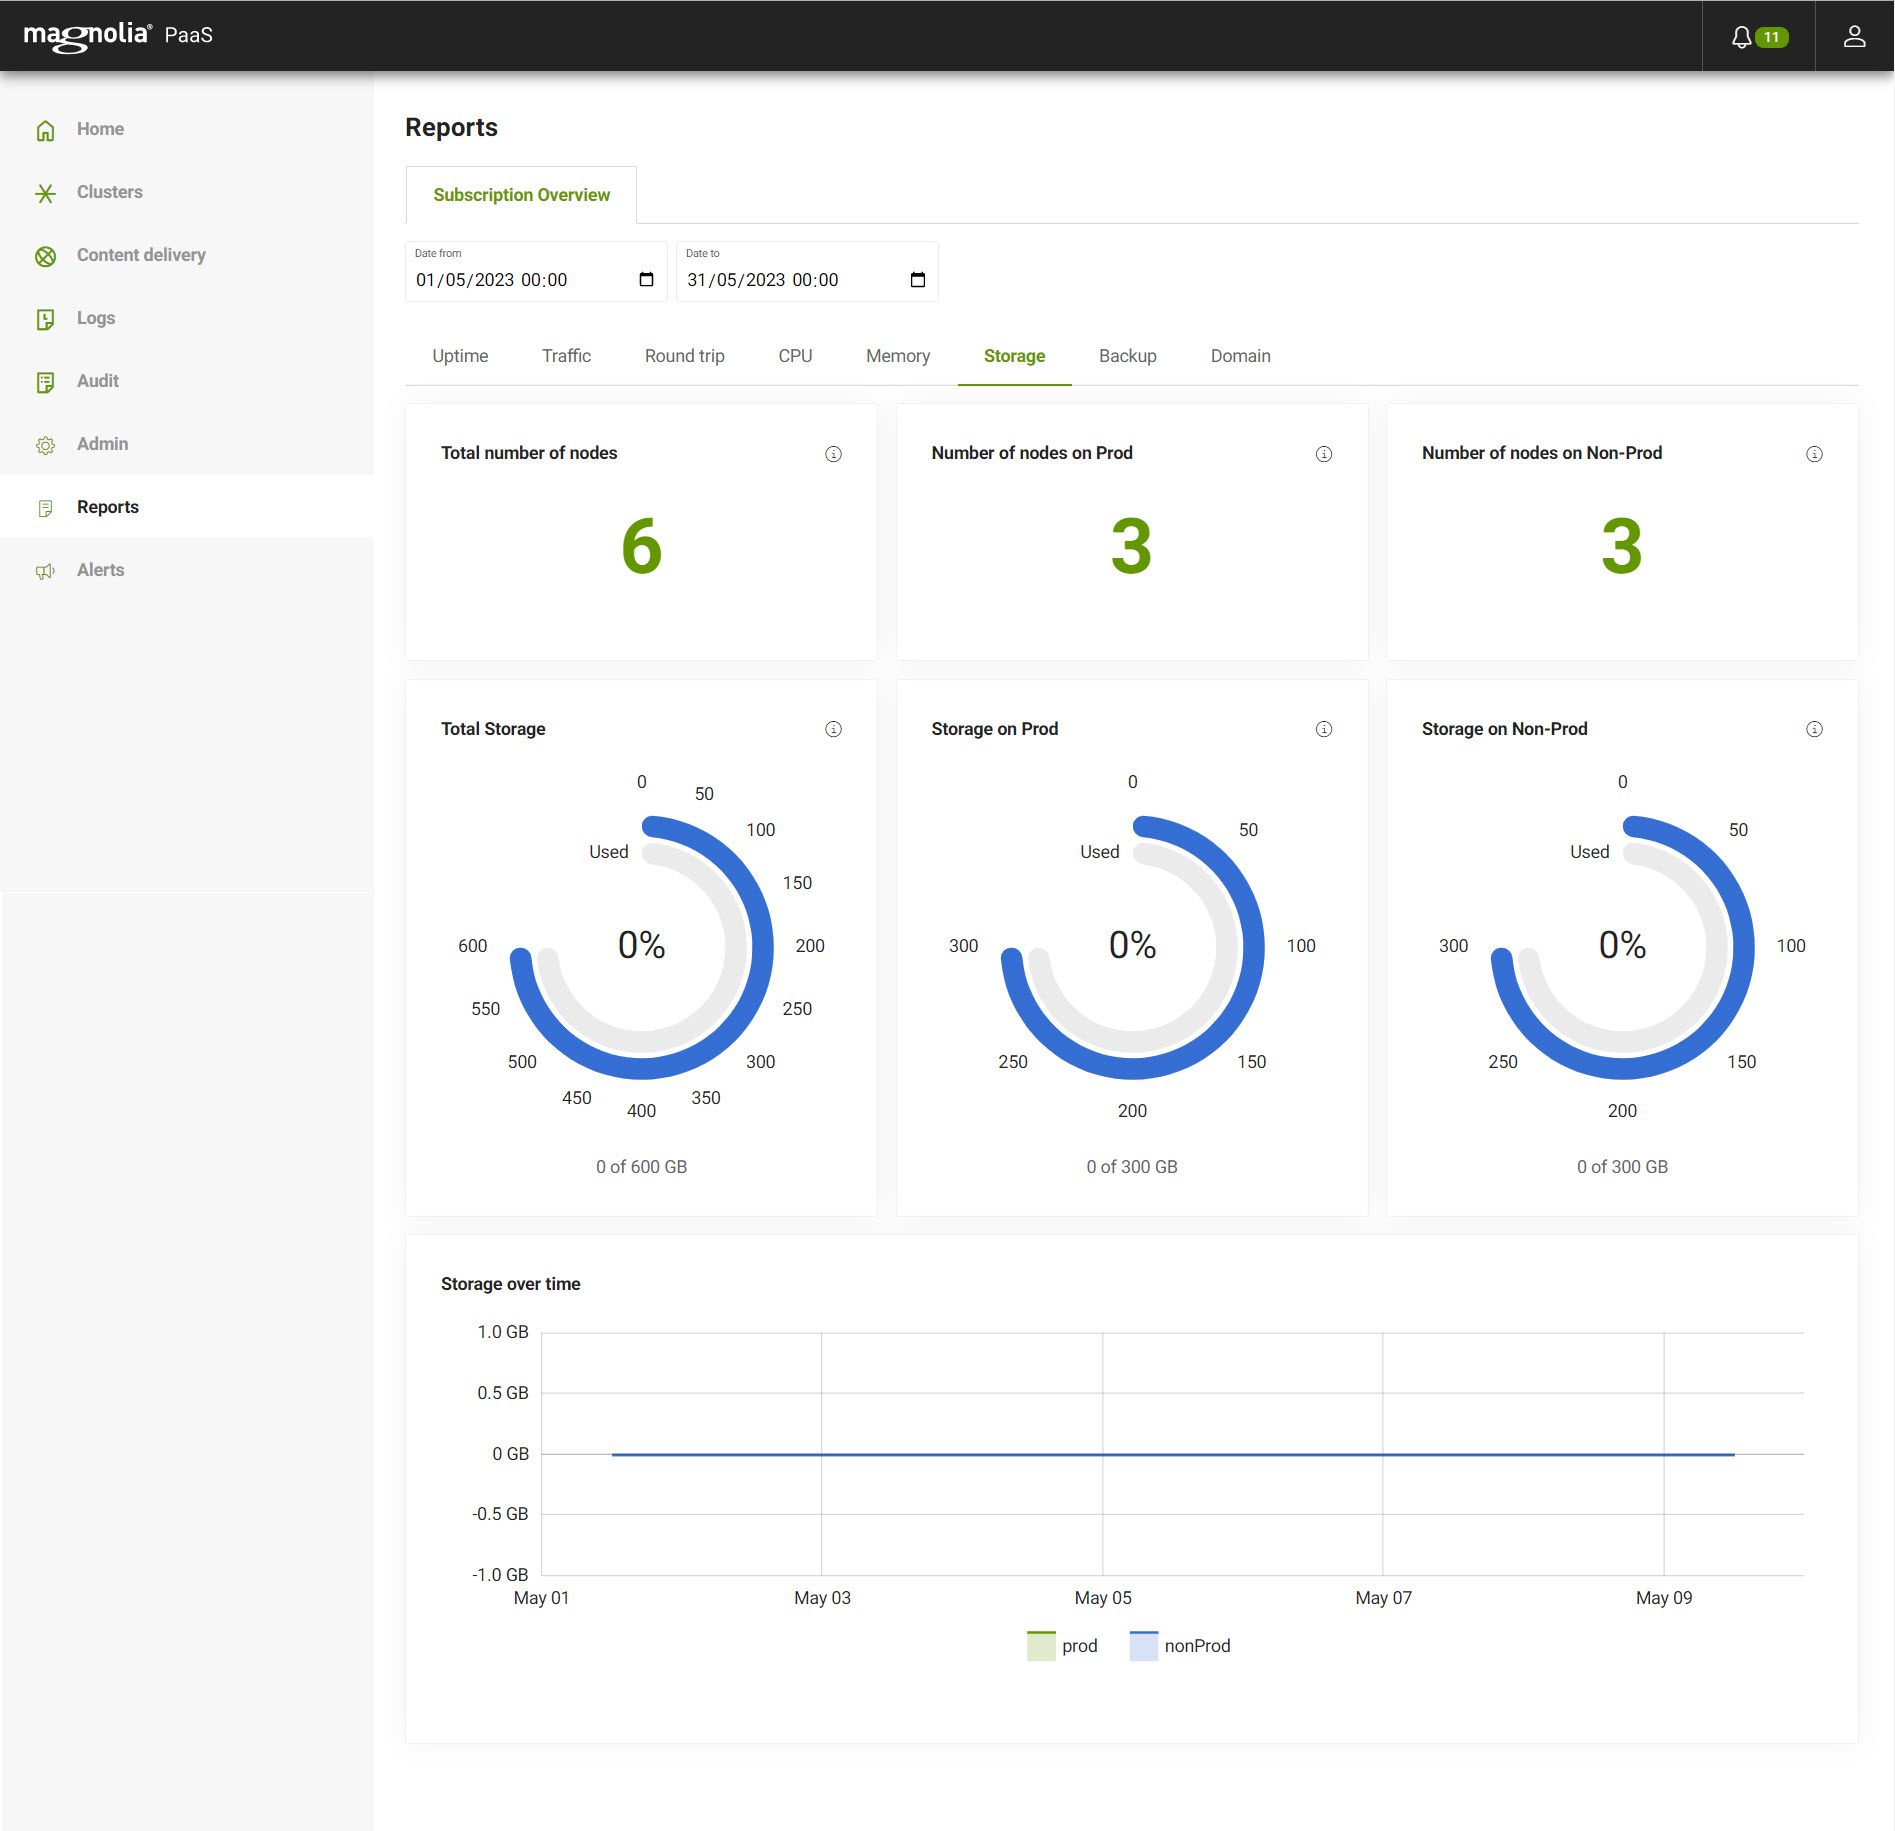
The Storage subtab displays several items shown below. In this case, Storage refers to both system storage as well as any PersistentVolumeClaims.
-
Total nodes
-
Production nodes
-
Non-production nodes
-
Total Memory
-
Storage on Production
-
Storage on Non-production
-
Storage over time
The Storage over time graph allows you to select a more specific part of the already selected range. You can do this by hovering over the chart and clicking the area you want to analyze more closely.
View from the Cockpit
