Magnolia instance is down
This topic guides you on troubleshooting Magnolia instances that are down.
Symptom
A CustomerMagnoliaDown alert is firing.
CustomerMagnoliaDown alerts are sent to subscribers via email.
|
Observations
Here are the details on the alert:
Alert: CustomerMagnoliaDown
Expression |
|
Delay |
|
Labels |
|
Annotations |
|
| The alert metric is based on the "up" metric. The "up" metric is generated by Prometheus and means that Prometheus was able to successfully contact the Magnolia instance and collect metrics from it. |
There are a number of reasons that Prometheus can fail to collect metrics from a Magnolia instance:
-
The Magnolia instance is not running.
-
The metrics collection job for the Magnolia instance is misconfigured.
-
The Magnolia instance does not respond to the metrics request within the scrape timeout.
-
The Magnolia instance is not responding to requests.
-
The metrics endpoint (
/<app context>/.monitoring/scrape) is not accessible to Prometheus.
Check Magnolia is running
The alert will note the affected Magnolia pod. You can check if Kubernetes considers the Magnolia instance is running in Rancher or with kubectl.
Check Magnolia metrics collection job configuration
Metrics are collected from the Magnolia pod by a Prometheus instance running on the local cluster. You can check the status of the metrics collection job by connecting to the local Prometheus instance.
-
Connect to Prometheus.
kubectl -n monitoring port-forward pod/prometheus-monitoring-kube-prometheus-prometheus-0 9090 (1)1 Connect to the Prometheus instance with a browser at http://localhost:9090. -
Click on the "Status" menu and select "Targets".
You should now see the status of all metrics collection jobs on the local Prometheus instance.
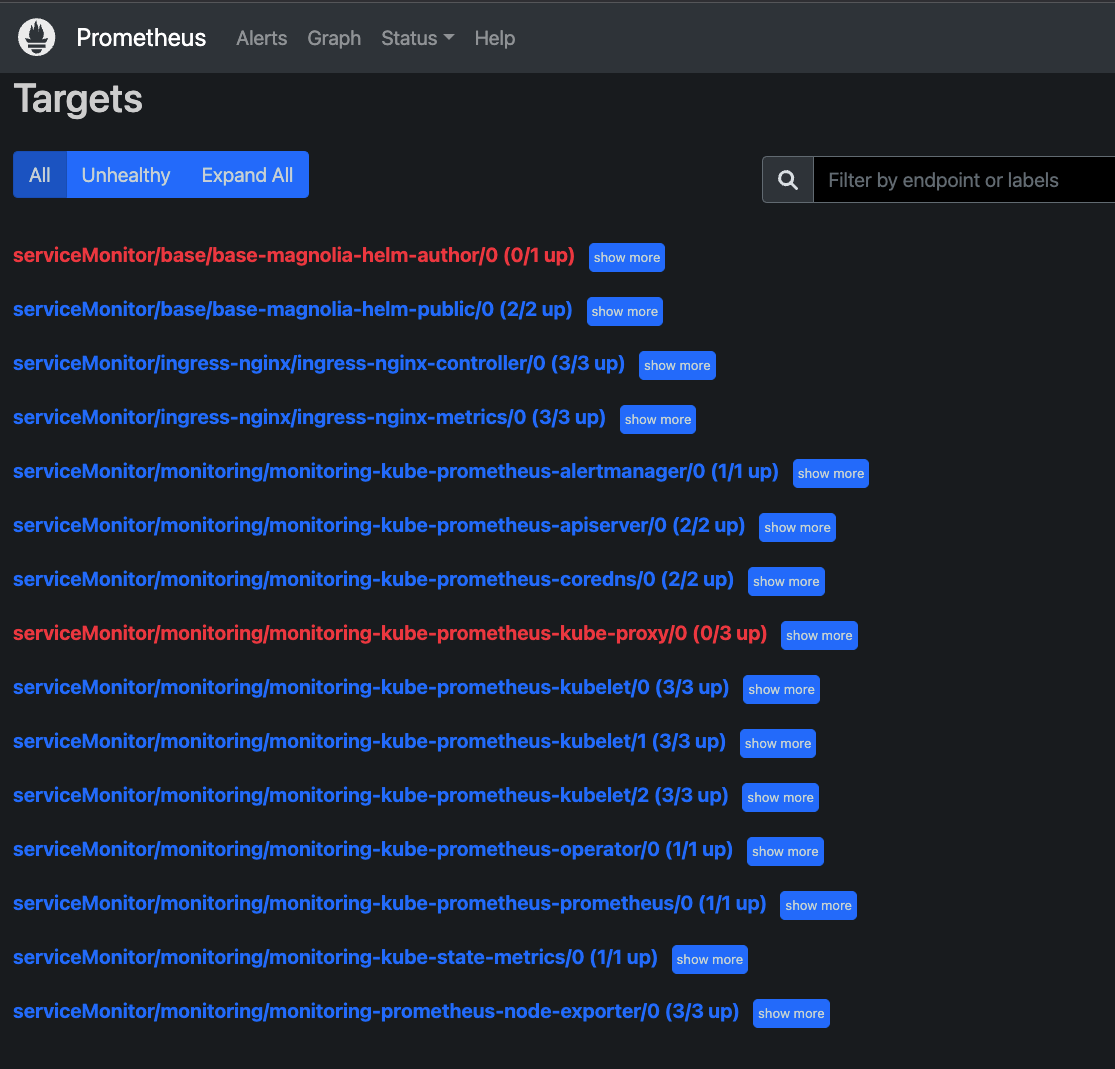
-
Click on "show more" of the metrics collection job of the desired Magnolia instance:
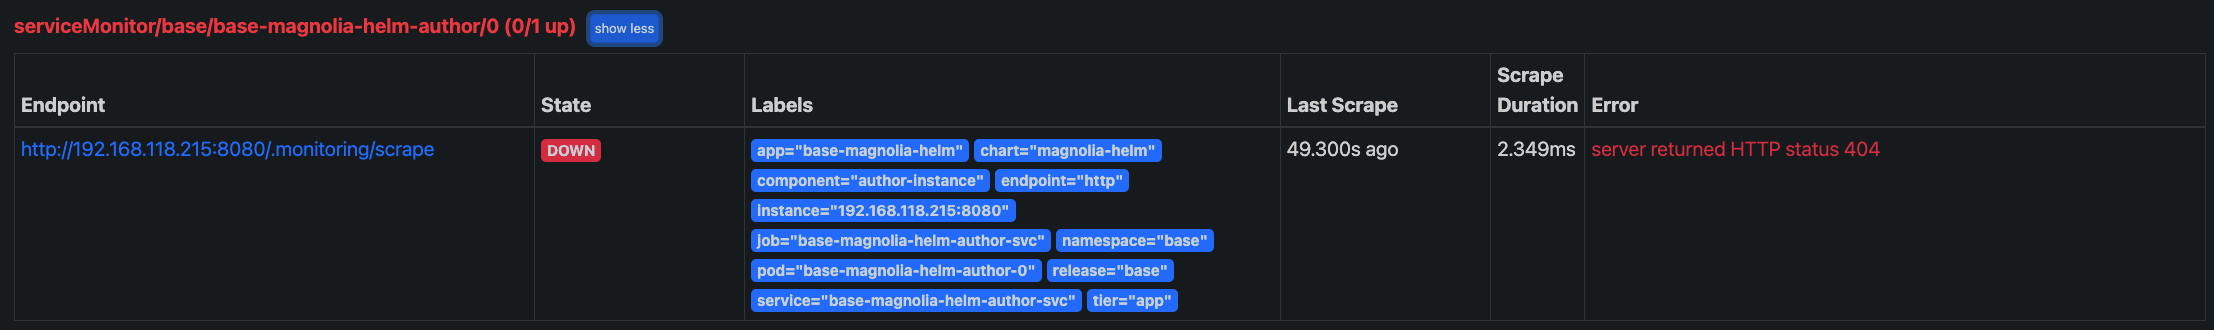
Note the endpoint, the scrape time (Last Scrape), and the error reported by Prometheus.
Action: Check that the metrics endpoint is accessible
-
Connect to the Magnolia instance with port forwarding:
kubectl -n <namespace from alert> port-forward pod/<Magnolia pod from alert> 8080 (1)1 This should allow you to access http://localhost:8080/.metrics/scrape.
You may need to add an application context (e.g. /author/.metrics/scrape) if Magnolia has been deployed with a context.
|
Magnolia should return metrics like this:
# HELP jvm_memory_bytes_used Used bytes of a given JVM memory area.
# TYPE jvm_memory_bytes_used gauge
jvm_memory_bytes_used{area="heap",} 3.851850344E9
jvm_memory_bytes_used{area="nonheap",} 2.906232E8
# HELP jvm_memory_bytes_committed Committed (bytes) of a given JVM memory area.
# TYPE jvm_memory_bytes_committed gauge
jvm_memory_bytes_committed{area="heap",} 7.732199424E9
jvm_memory_bytes_committed{area="nonheap",} 3.05815552E8
# HELP jvm_memory_bytes_max Max (bytes) of a given JVM memory area.
# TYPE jvm_memory_bytes_max gauge
jvm_memory_bytes_max{area="heap",} 7.732199424E9
jvm_memory_bytes_max{area="nonheap",} -1.0
# HELP jvm_memory_bytes_init Initial bytes of a given JVM memory area.
# TYPE jvm_memory_bytes_init gauge
jvm_memory_bytes_init{area="heap",} 2.01326592E8
jvm_memory_bytes_init{area="nonheap",} 7667712.0
...
Solutions
This section provides solutions that should help resolve the issue in most cases.
Prometheus reports 404 when collecting metrics
If Magnolia is up and running but the Prometheus metrics collection returns a 404, you can change the metrics scrape path.
Change the scrape path by adding an annotation to the service using the Magnolia instance:
kubectl -n <namespace> annotate service <deployment>-magnolia-helm-author-svc "magnolia.info/context-path"="/<app context>/.monitoring/scrape" --overwrite|
The application context for author instances is usually Prometheus will detect the new path from the service annotation, reload its configuration and collecting metrics from Magnolia. This can take a 1 - 3 minutes. Connect to the local Prometheus instance as described above using port forwarding and check the status of the scrape jobs. |
Prometheus reports 403 when collecting metrics
This means you cannot access metrics endpoint with port forwarding. The configuration of the metrics endpoint included in the instrumentation module should allow anonymous access to the endpoint.
-
In AdminCentral, go to the Security app.
-
Go to the Roles tab within the app.
-
Select the anonymous role from the list.
-
With anonymous selected, click Edit role.
-
Go to the Web Access tab
-
Ensure the role is allowed to
GetandPostto/.monitoring/*.
-
Prometheus reports a timeout when collecting metrics
If Magnolia does not respond with metrics within 10 seconds, the metrics collection job will fail. Metrics collection must fail for 30 minutes (30 consecutive failures) for this alert to be triggered.
This case is unlikely; failing to collect metrics for 30 minutes because of timeout shows Magnolia is highly loaded.
Other alerts, such as Magnolia author or public slow response or Tomcat is showing high load or slow requests, will likely fire.