Security
The Security section of the Cockpit provides a place to configure important security parameters for your site’s deployment such as metrics on the Web Application Firewall (WAF).
Webapp firewall
Web Application Firewalls, or WAFs, protect web applications from common malicious attacks such as cross-site-scripting (XSS) and SQL injections. Essentially, they act as a type of wall or shield between your web application and the internet. If you have your own CDN for your project, you’ll likely have your own WAF.
If you choose to go with the default CDN for DX Cloud, you’ll be protected with the Fastly WAF.
The Fastly WAF inspects the web traffic at the HTTP application layer by looking at all HTTP and HTTPS requests (both header and body included). This can be configured specifically for your deployment.
View Webapp firewall information
To view passed, logged, and blocked requests for your WAF:
-
Go to Security > Webapp firewall.
-
Select the desired Cluster Id from the dropdown list.
-
Select the desired Domain Name from the dropdown list.
-
Select the Range for the statistics.
See the Webapp firewall graphs below for more details on each metric.
Webapp firewall graphs
You can view information on the Traffic as well as the Origin of requests easily in the Cockpit. You can also easily see which attacks occur most often in the Blocked tab and the top IPs in the IP tab.
Traffic
Under the Traffic tab, you can view the following:
| Metric | Description and Visual | ||
|---|---|---|---|
Total requests |
Displays the total requests to the WAF in the specified time period.
|
||
Total blocked requests |
Displays the total blocked requests to the WAF in the specified time period.
|
||
Total requests per WAF status |
Displays the total requests broken down by WAF status.
|
||
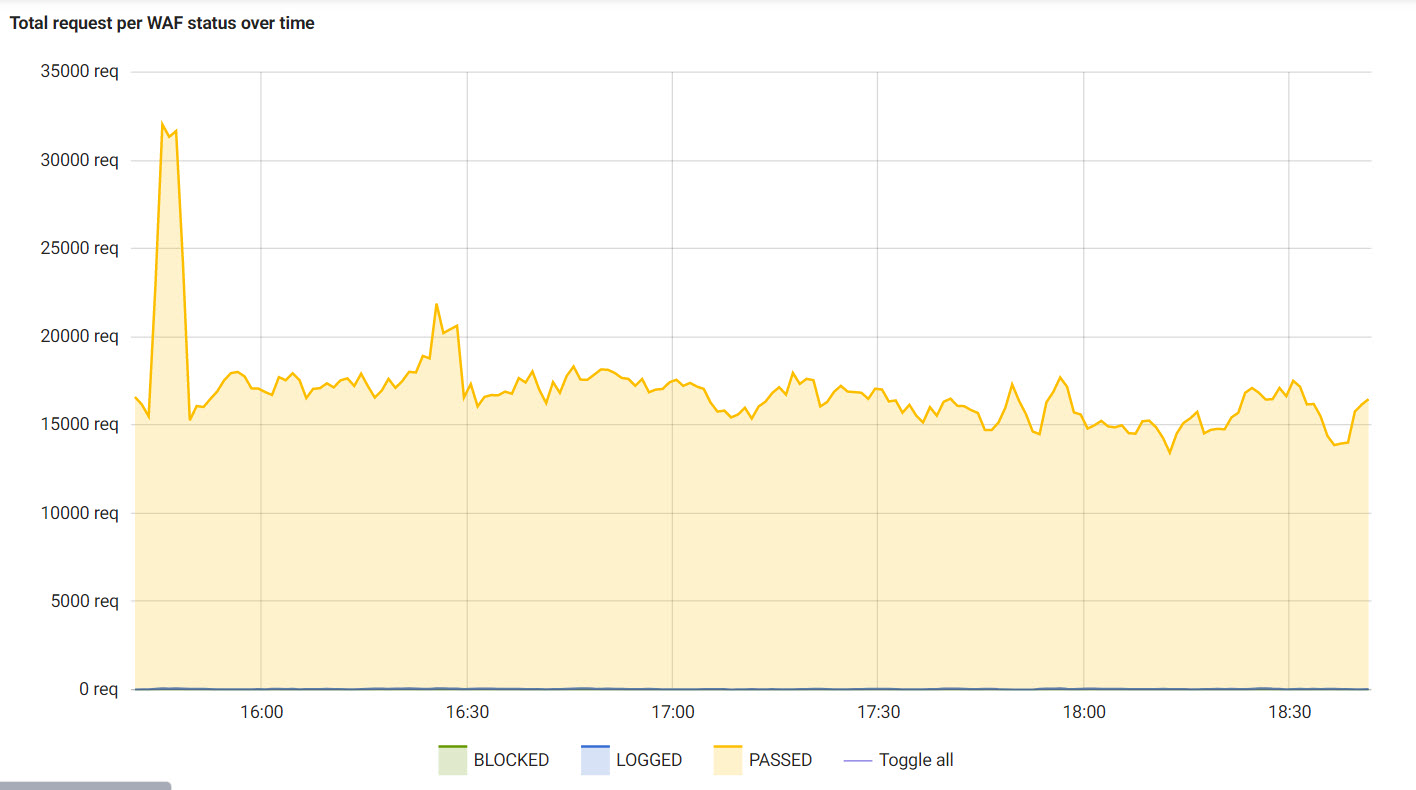
Total requests per WAF status over time |
Displays the total requests broken down by WAF status by the time period.
|
Origin
Under the Origin tab, you can view the following:
| Metric | Description and Visual | ||
|---|---|---|---|
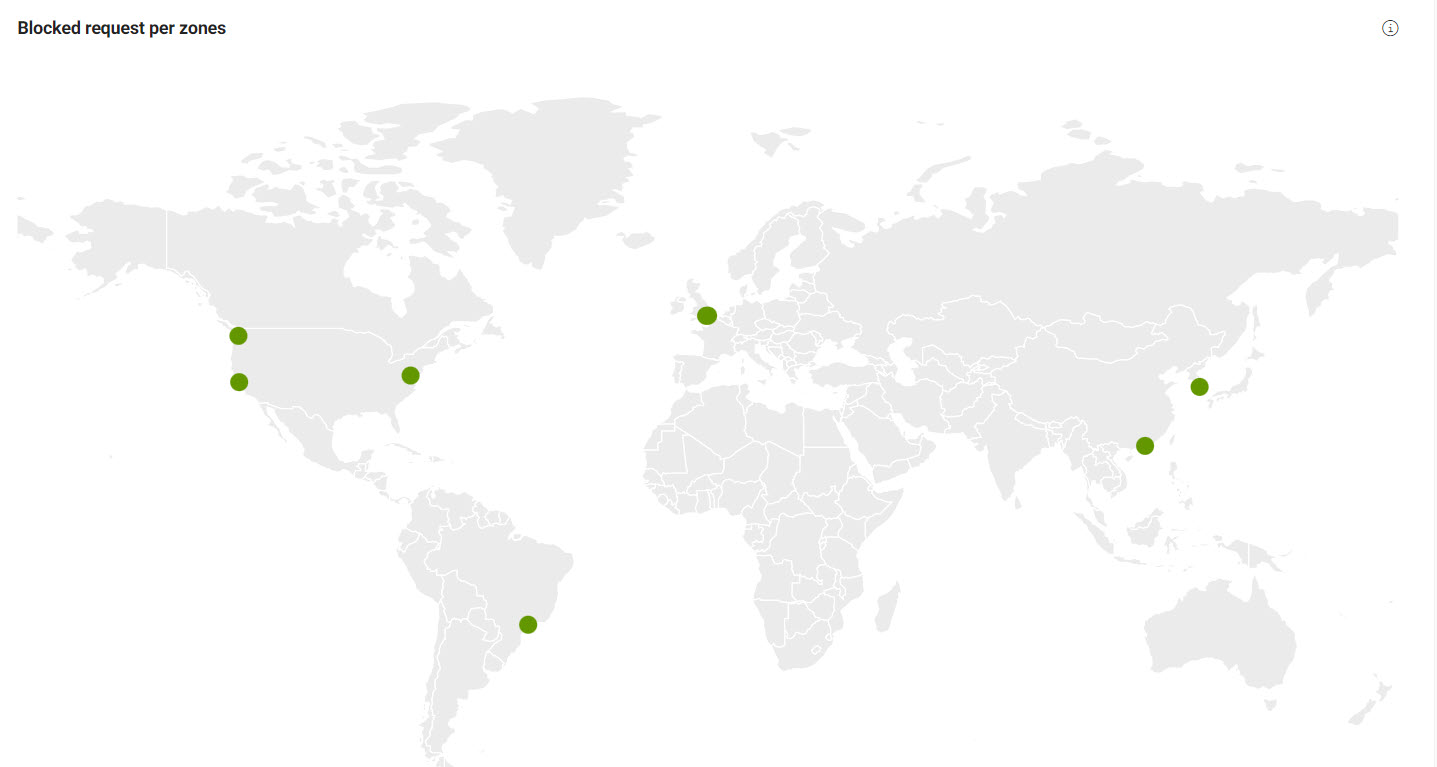
Blocked request per zones |
Displays (as a map) the blocked requests per geographic zone.
|
Blocked
Under the Blocked tab, you can view the following:
| Metric | Description | ||
|---|---|---|---|
Attacks per type |
This graphic shows you the attacks per type for the selected cluster, domain, and time period. |
||
Attacks per rule |
This graphic shows you the attacks per rule for the selected cluster, domain, and time period.
|
||
Attacks per path |
This graphic shows you the attacks per path for the selected cluster, domain, and time period. |


