How to configure Adobe Analytics data in an IUX slot with filters
This developer-targeted page explains how to display and filter data from Adobe Analytics in a Magnolia IUX slot.
| IUX slots are places in the AdminCentral UI where elements from integrated applications or other Magnolia content apps can live. Elements such as charts and widgets add value to the user’s workflow inside Magnolia. We pull in data from adjacent applications and content apps and display it in the right places so that users do not need to switch contexts. |
This page covers how to:
-
Prepare data-elements and rules in Adobe Experience Platform Launch to send data from Magnolia to your Adobe solution.
-
Set up the YAML configuration for the Adobe Analytics data to be displayed in Magnolia IUX slots.
Prerequisites
We assume you:
-
Are familiar with the Magnolia Analytics module.
-
Are familiar with the Adobe Analytics API
-
Know how to set up Adobe Experience Platform Launch.
-
Have a working Adobe report suite id and a Magnolia site deployed with an Adobe embed code <script> tag.
If this is not the case, start by carefully following the instructions in the Adobe Experience Platform Launch user guide.
Use case 1: Display a chart showing visits to a page over 7 days
In our first use case, we want to display Adobe analytics in an IUX slot to show how many people visit our page /travel within a 7-day period.
Adobe provides a Reporting API that supports some filtering functionality such as Global Filters and Filtering Reports. However, this functionality does not meet our requirements.
|
In our example, we want to show the following data:
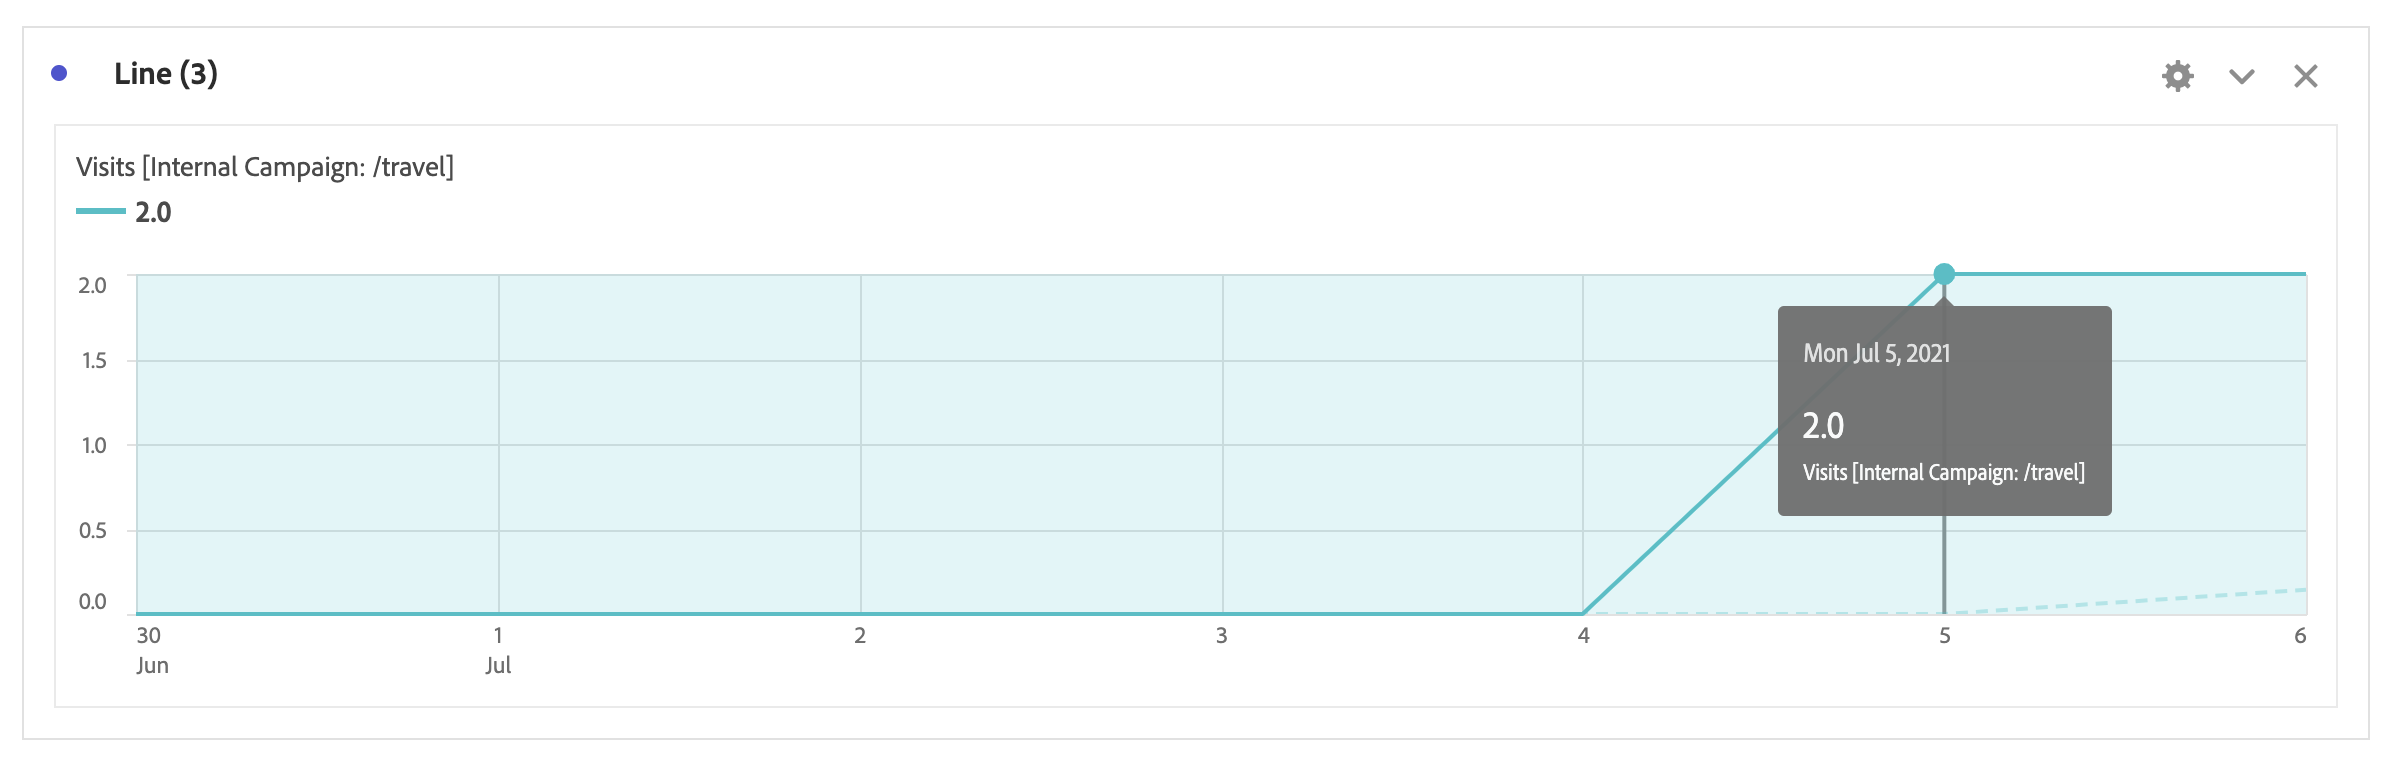
The chart, or report, above shows us the number of visits to the page /travel from 30 June to 6 July.
This data is a combination of the dimension variables/daterangeday with the metric metrics/pageviews, filtered using the custom variable variables/evar1 where the item value is /travel
To get this data, we use Breakdown Reports.
Breakdowns in the API are useful when you want to see the cross-product of values from two different dimensions.
When requesting a breakdown report, we use the metricsFilters and dimension parameters to request the additional dimension.
This type of report does not support a filter expression for a dimension value such as contains /travel. Therefore, we must set up a custom eVar dimension to match the stored value of the page path.
Set up custom variables in Adobe Launch
Here are the steps to set up a custom variable in Adobe Launch to store all node paths related to the page visited by users.
In this example, we use a custom variable called eVar1,but you can use any custom variable available that suits your requirements.
|
-
In Adobe Launch, add a
nodePathData Element.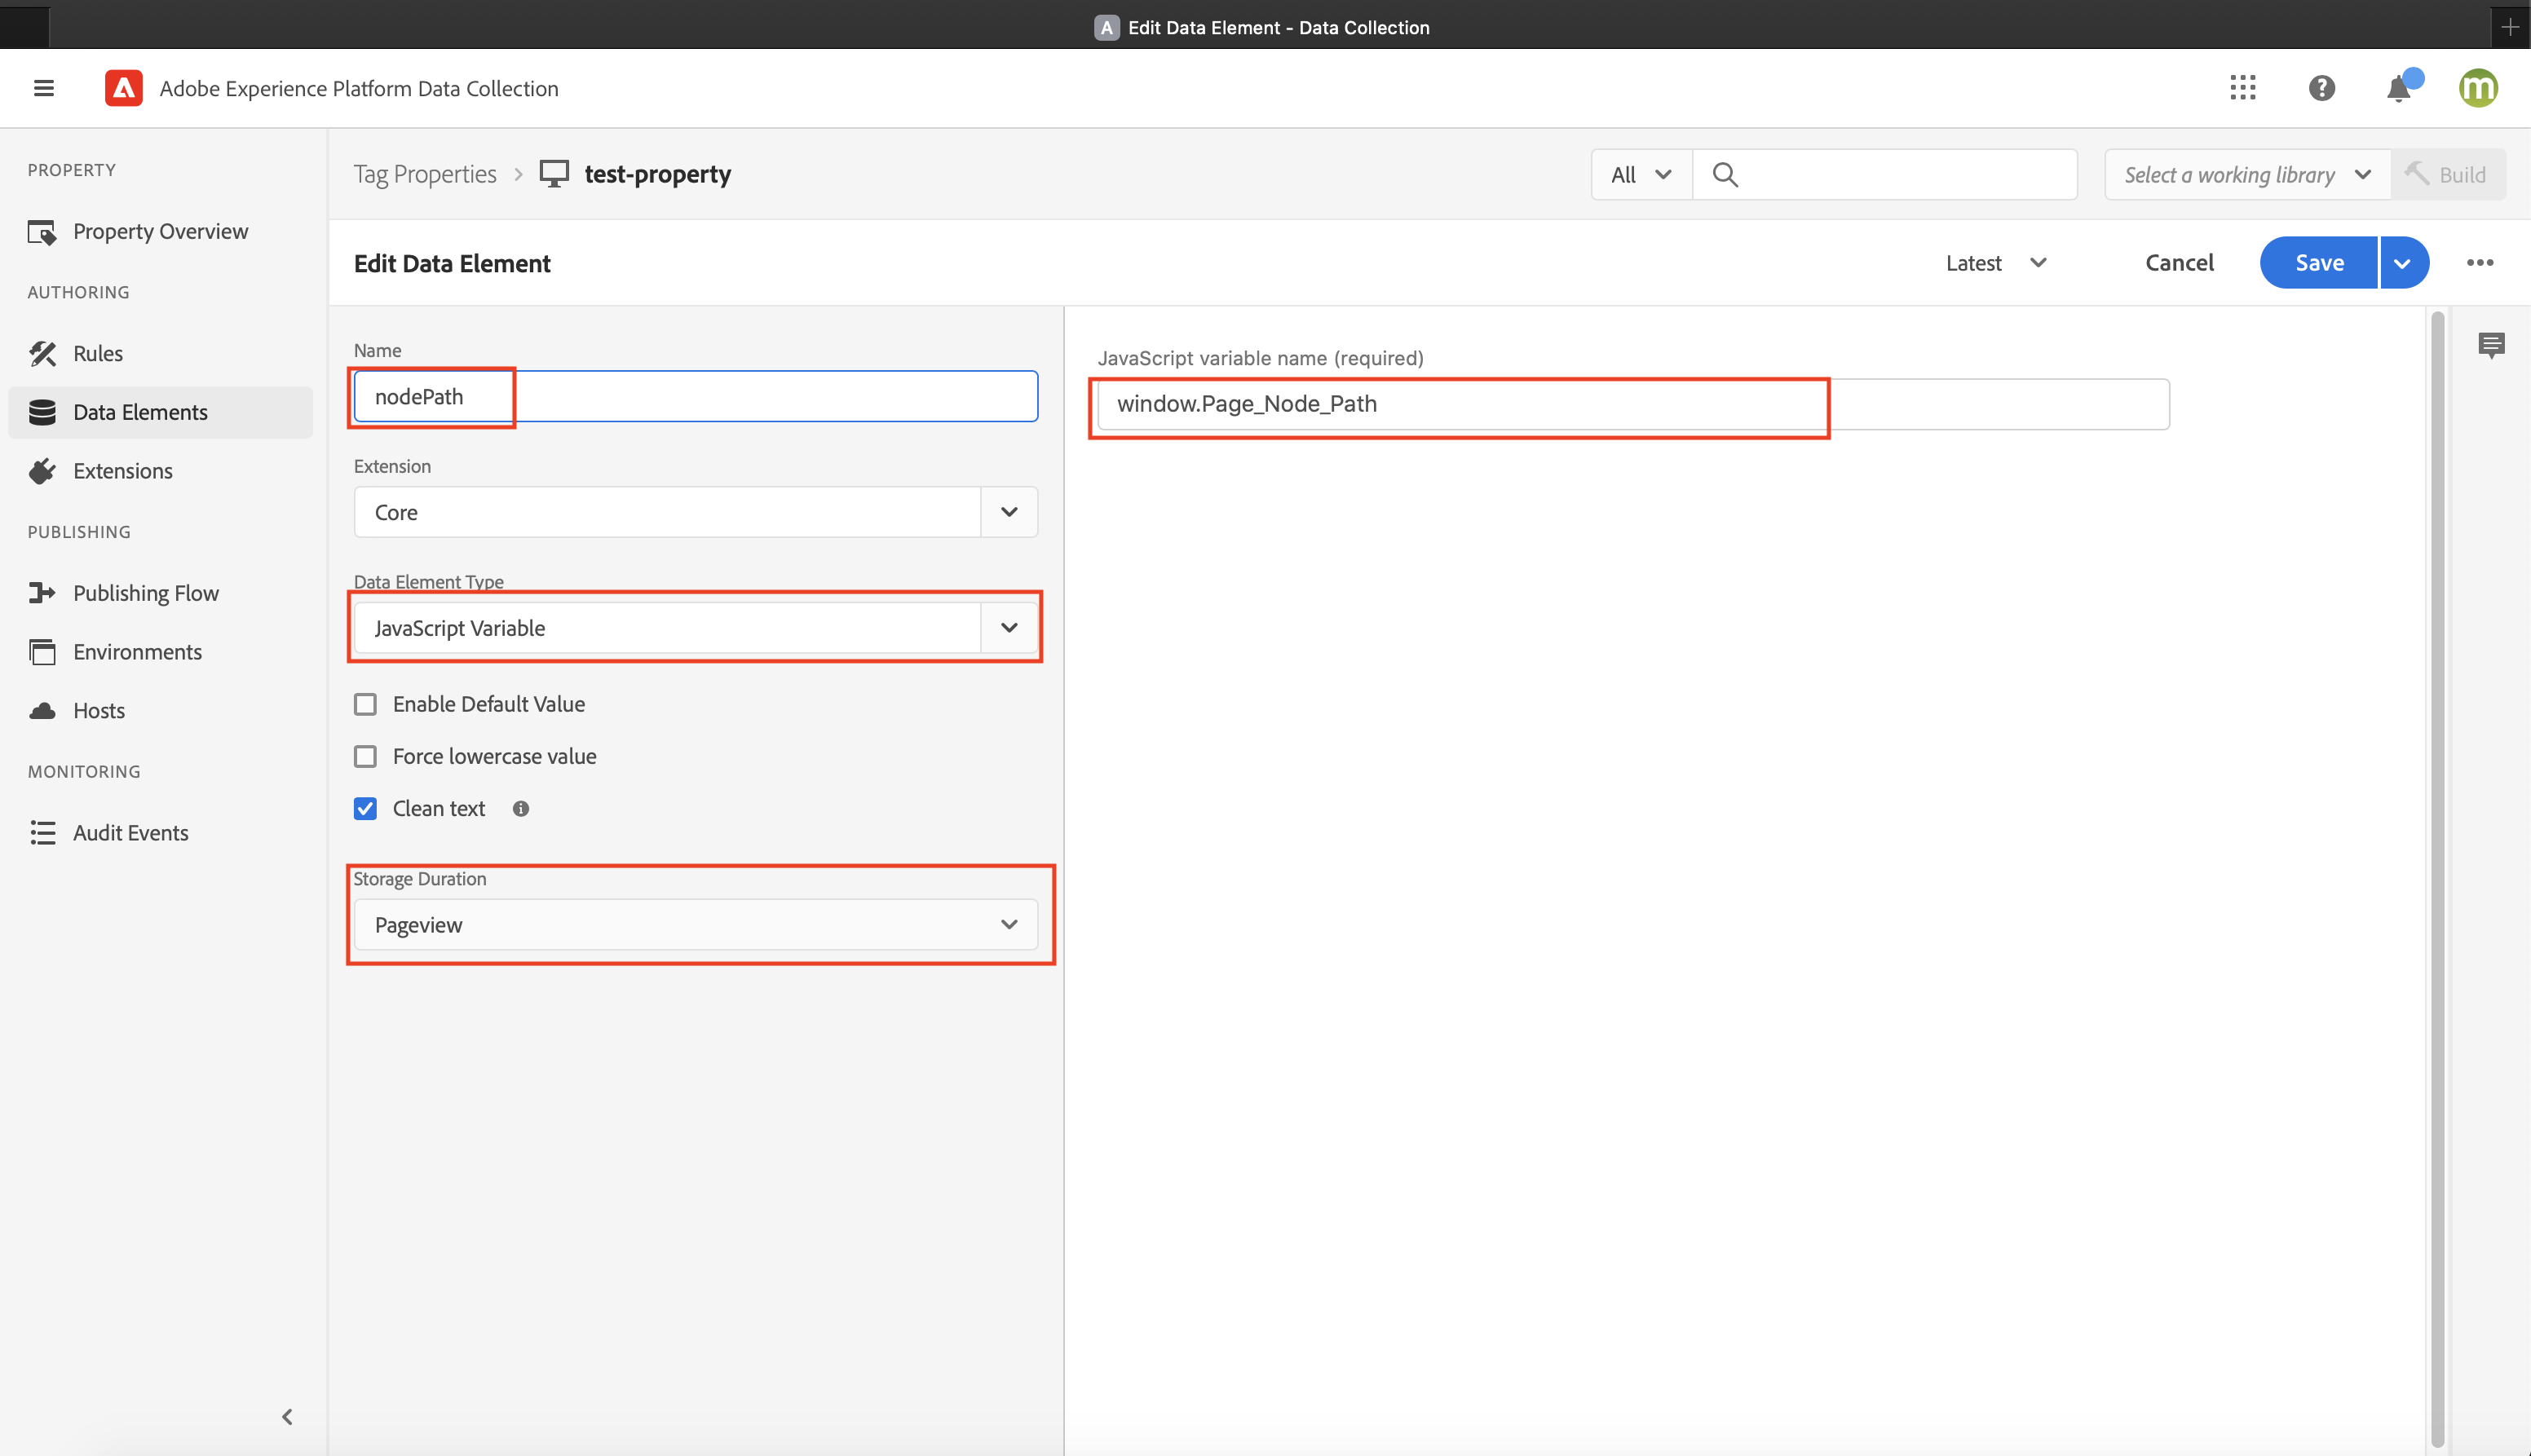
-
Edit your existing Rules to set up an
eVar1variable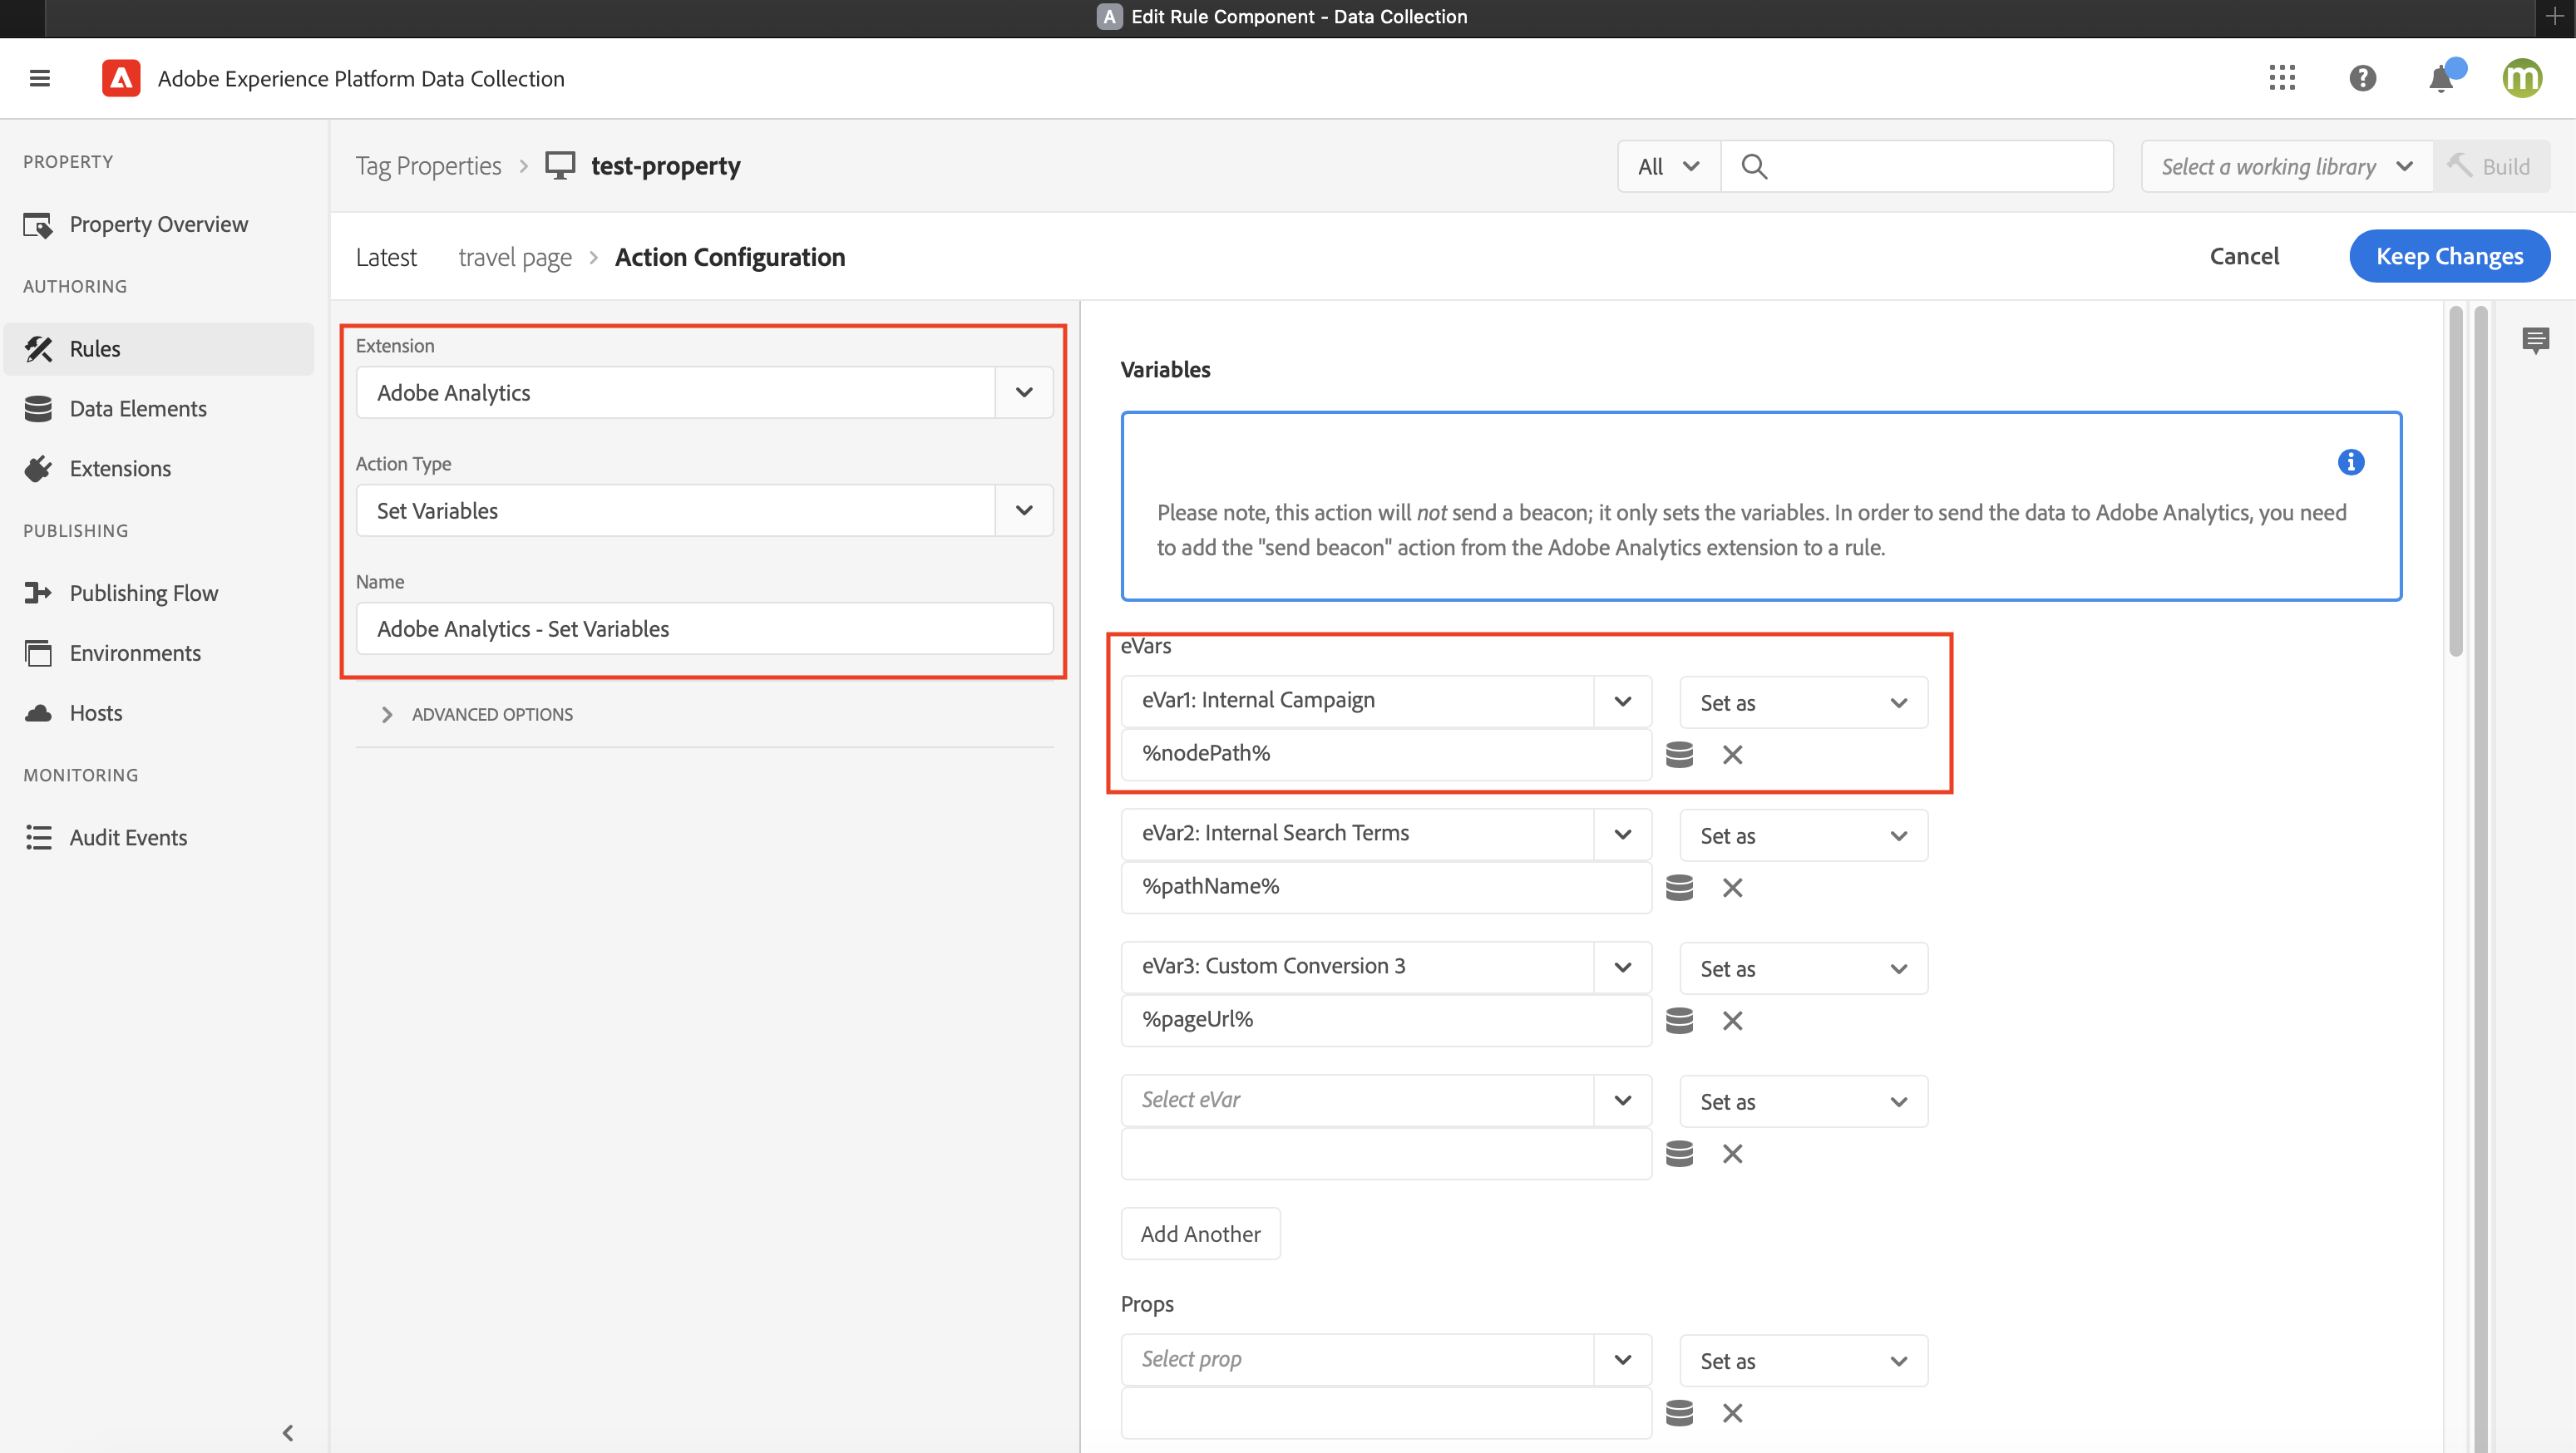
-
Make sure you publish every change in Publishing Flow.
-
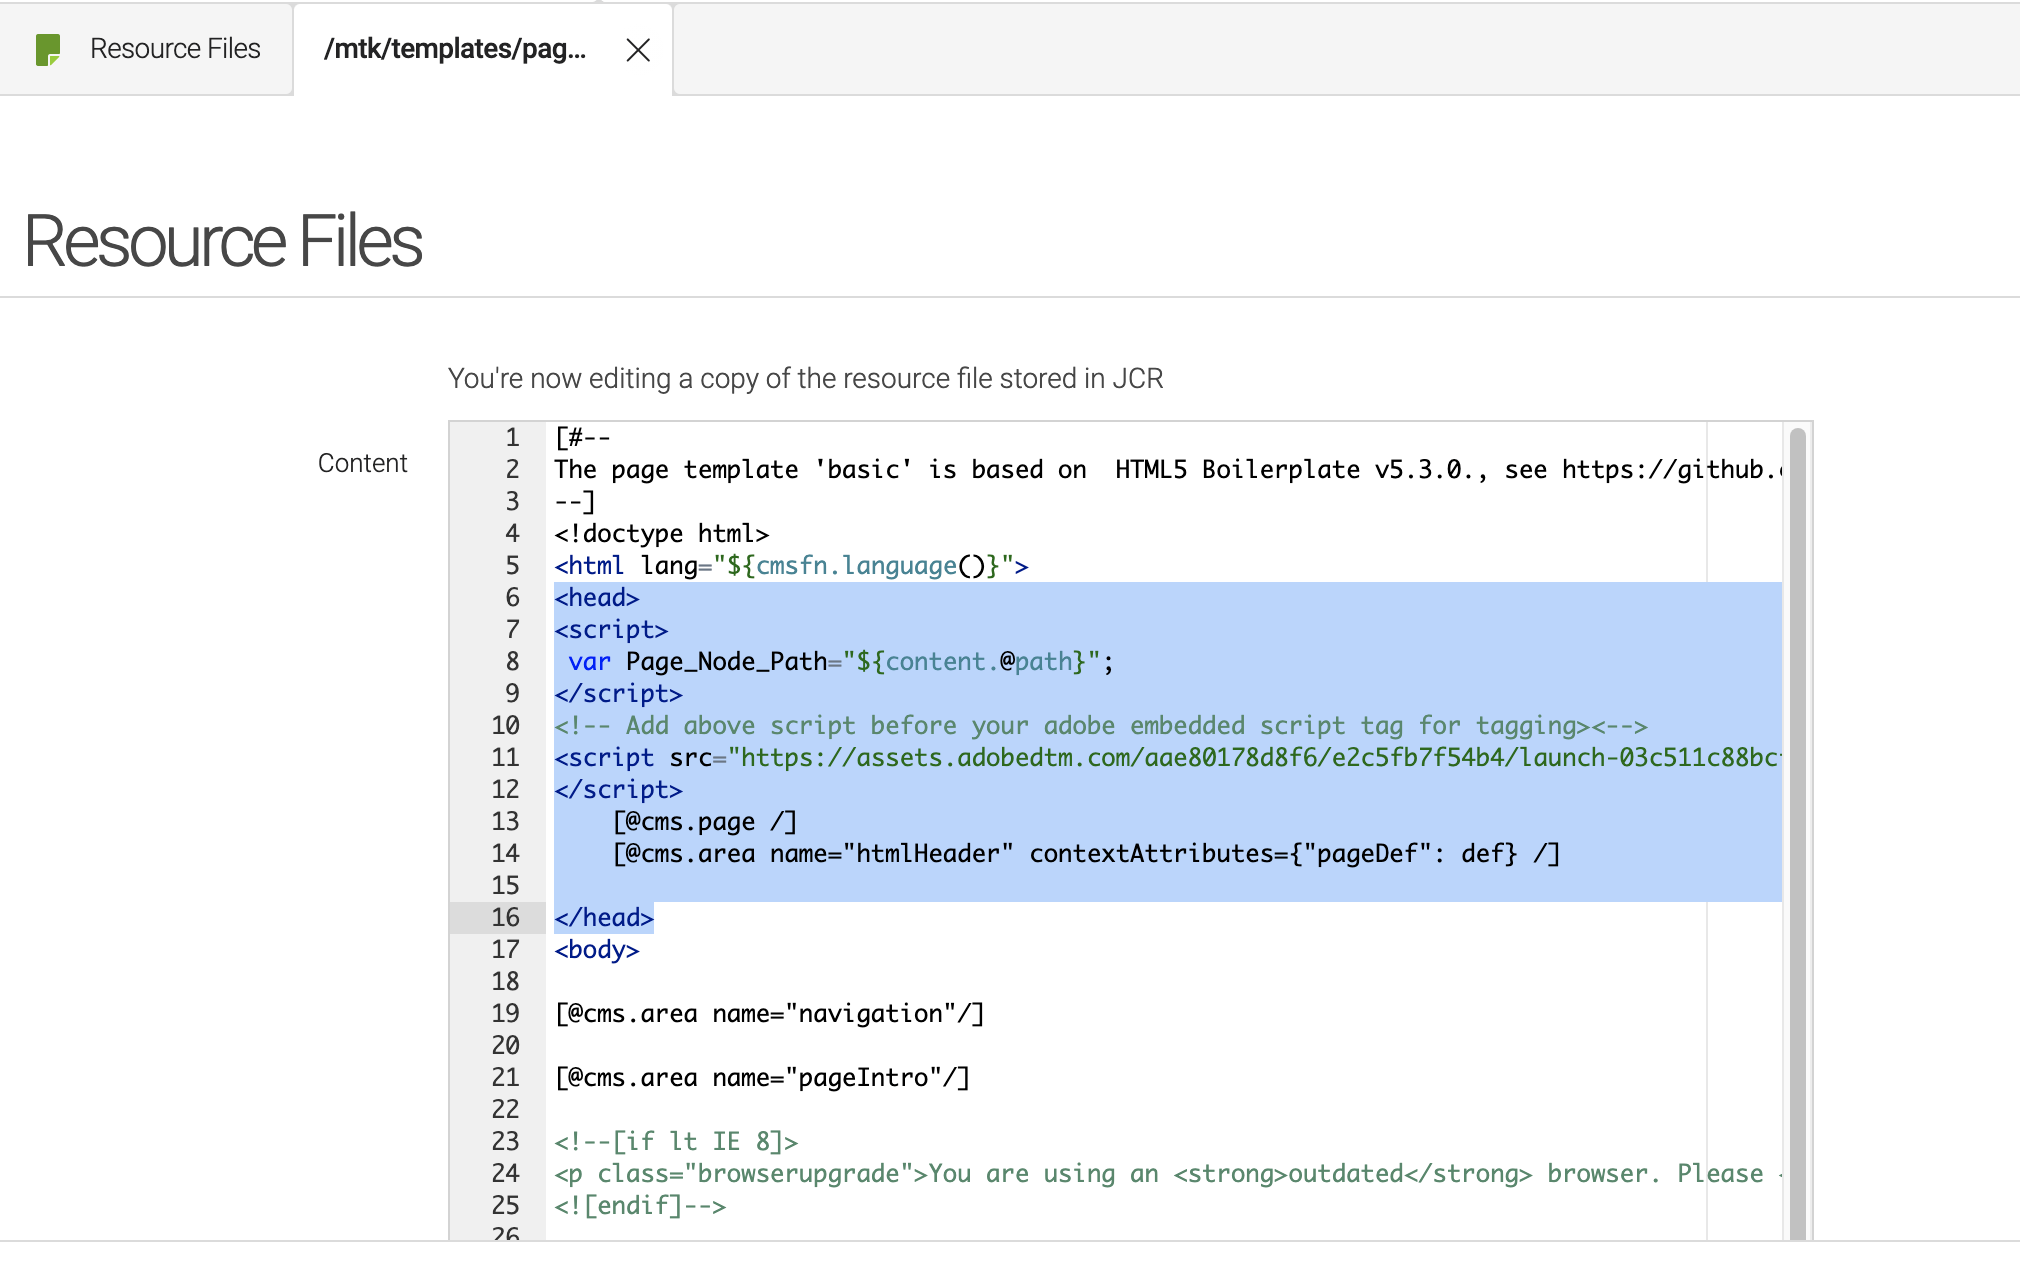
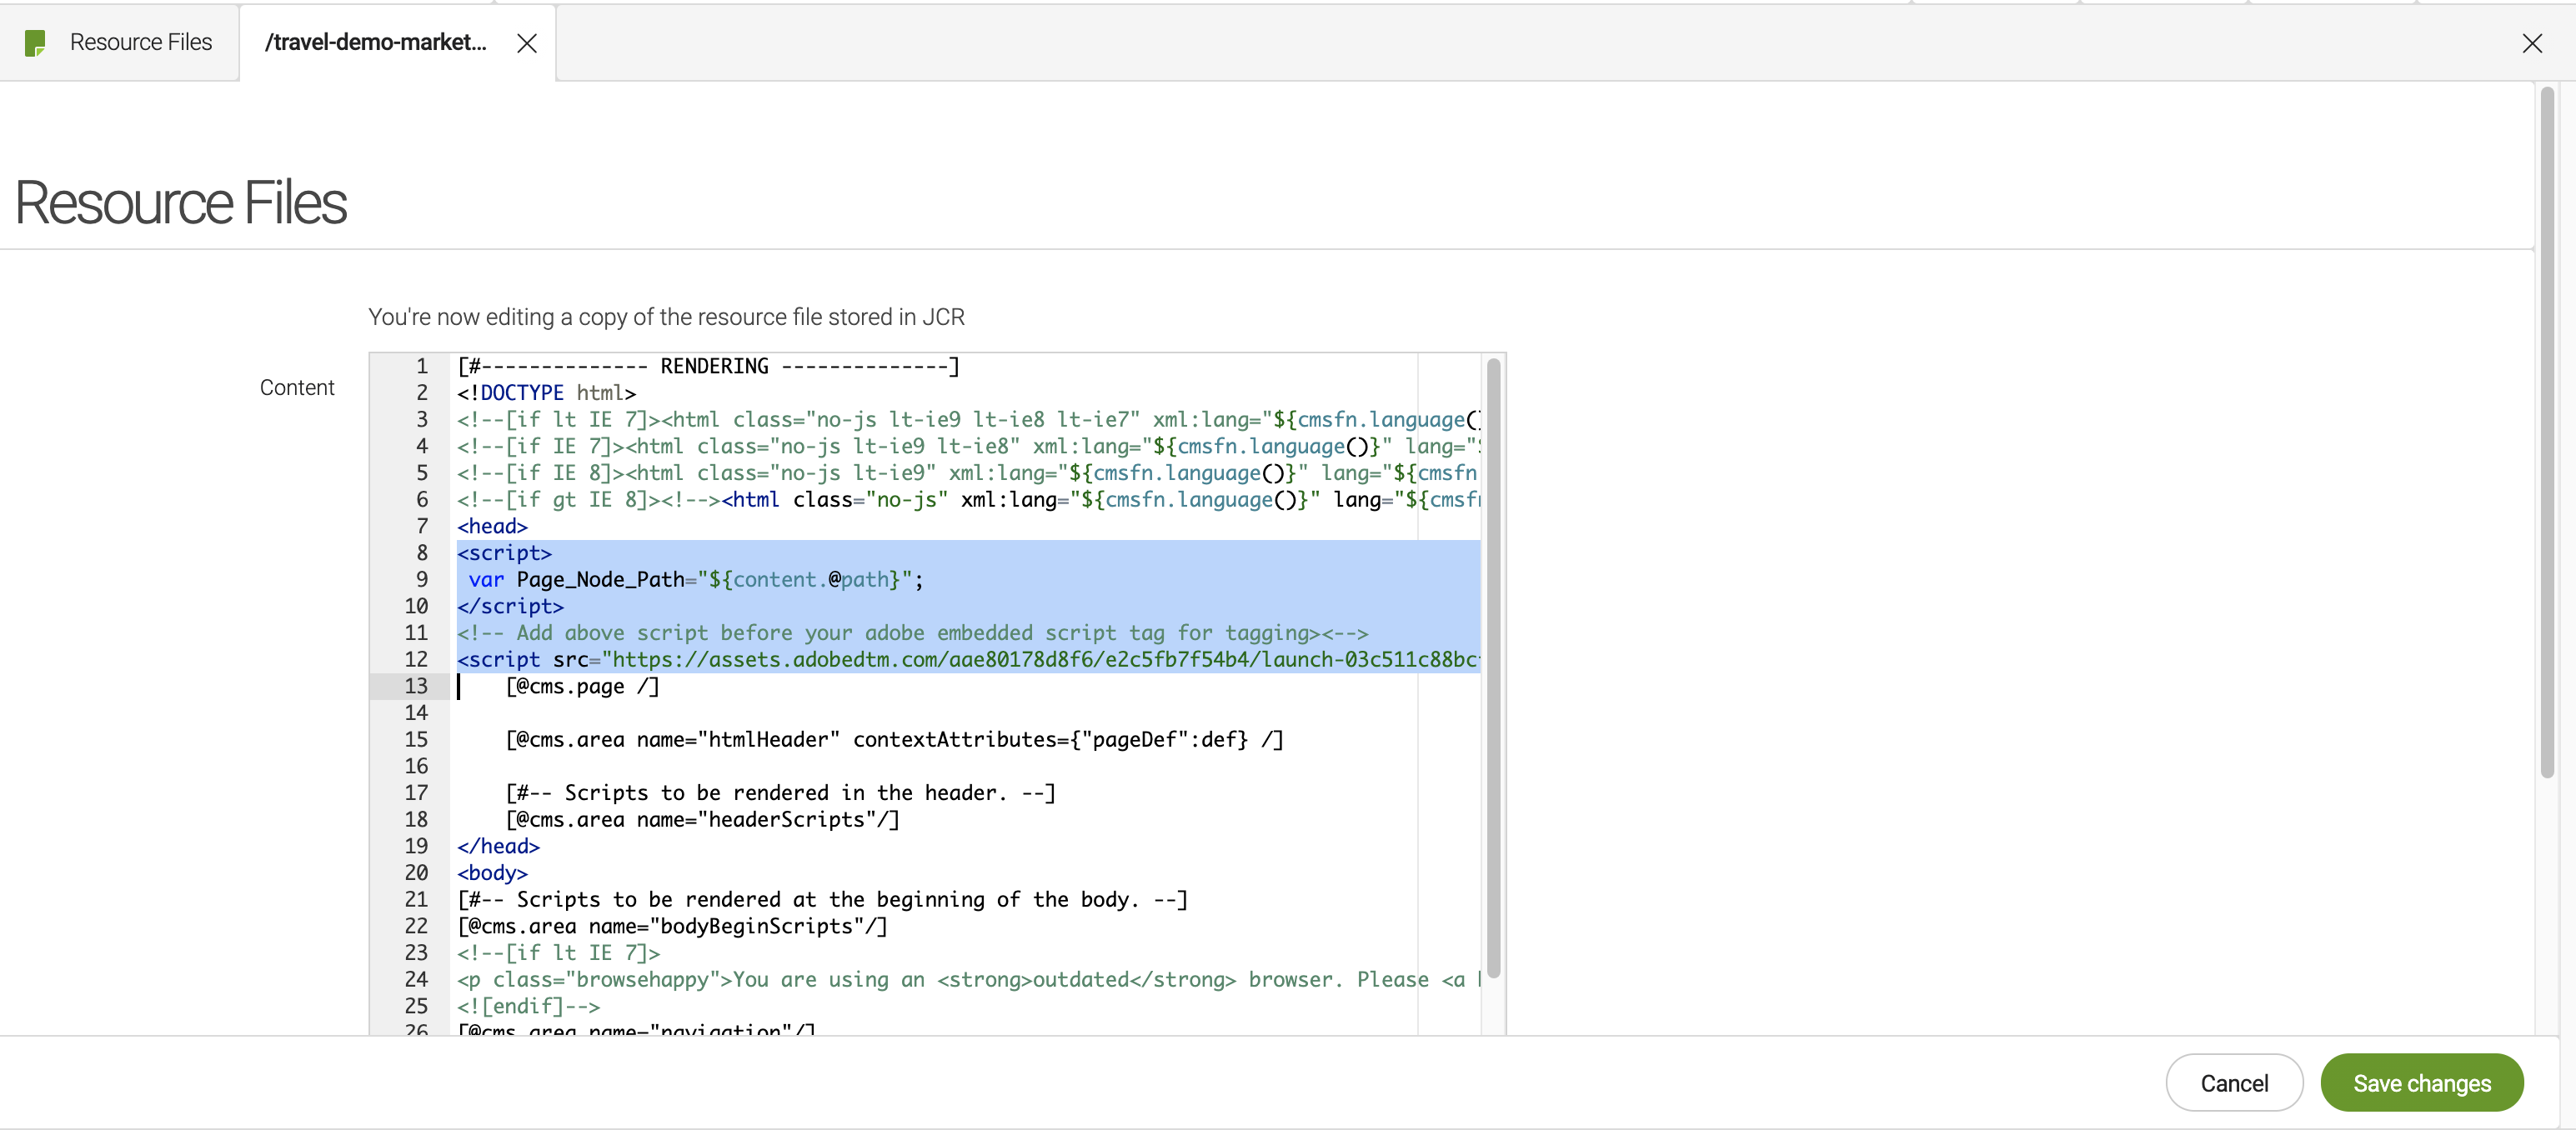
Update the Custom JavaScript Variables in your Magnolia site, add the
Page_Node_Pathvariable in your<head>element.<script> var Page_Node_Path="${content.@path}"; <!-- access variables content by Free marker ><--> </script> <!-- Add above script before your adobe embed script for tagging><--> <script src="https://assets.adobedtm.com/aae80178d8f6/e2c5fb7f54b4/launch-03c511c88bcf-development.min.js" async> </script>
JavaScript alternative to get the node path
If you don’t want to get the node path using Free marker code, you can replace it with JavaScript code to get the node path from the URL path name.
-
Replace
<script>
 var Page_Node_Path="${content.@path}";
</script>
with
<script> var Page_Node_Path=window.location.pathname.split(";")[0].split(".html")[0]; </script> -
Ensure your script can send
eVar1. You can check using the Adobe Experience Platform Debugger.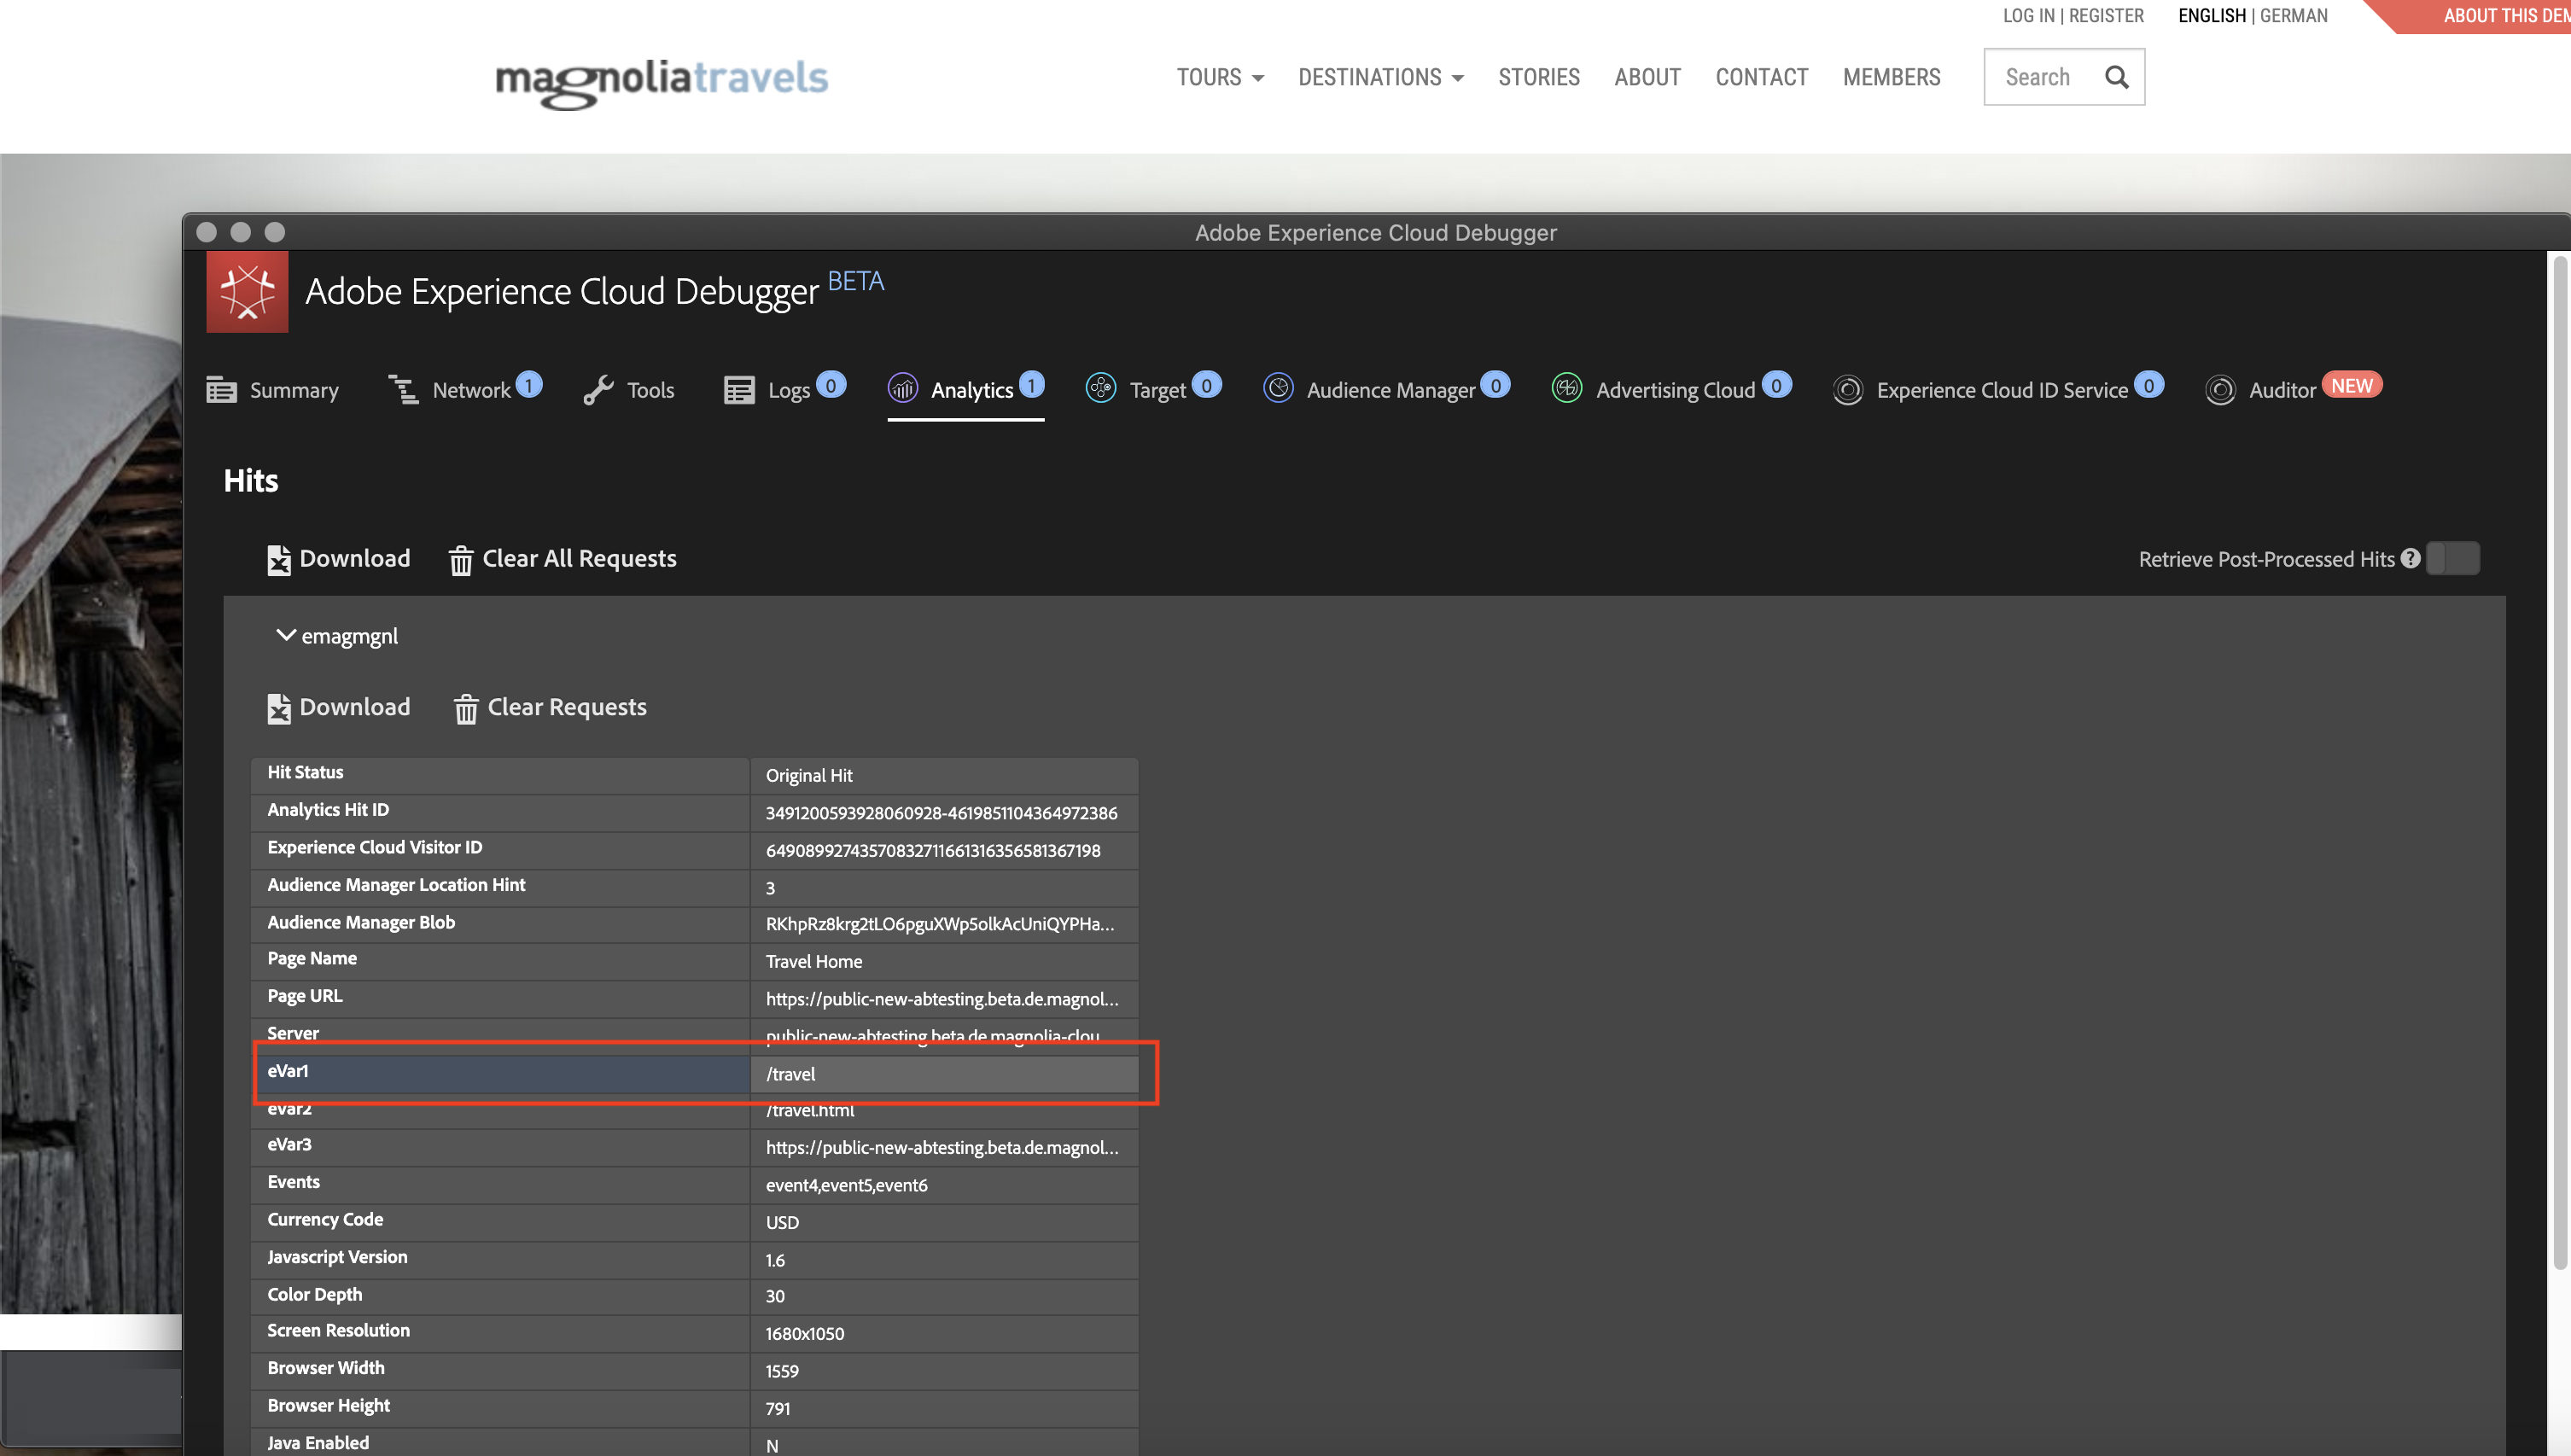
|
We recommend you try to fetch your report with Adobe Swagger first to ensure the custom variable Example JSON body request:
|
Use case 2: Display a chart showing visits to all pages with a given path name over 7 days
In our second use case, we want to display Adobe analytics in an IUX slot to show the Total visits to all pages containing /travel over a 7-day period.
For this use case, you follow the same steps as in use case 1 with some changes when preparing the data elements.
-
In Adobe Launch, add a
pathNameData Element.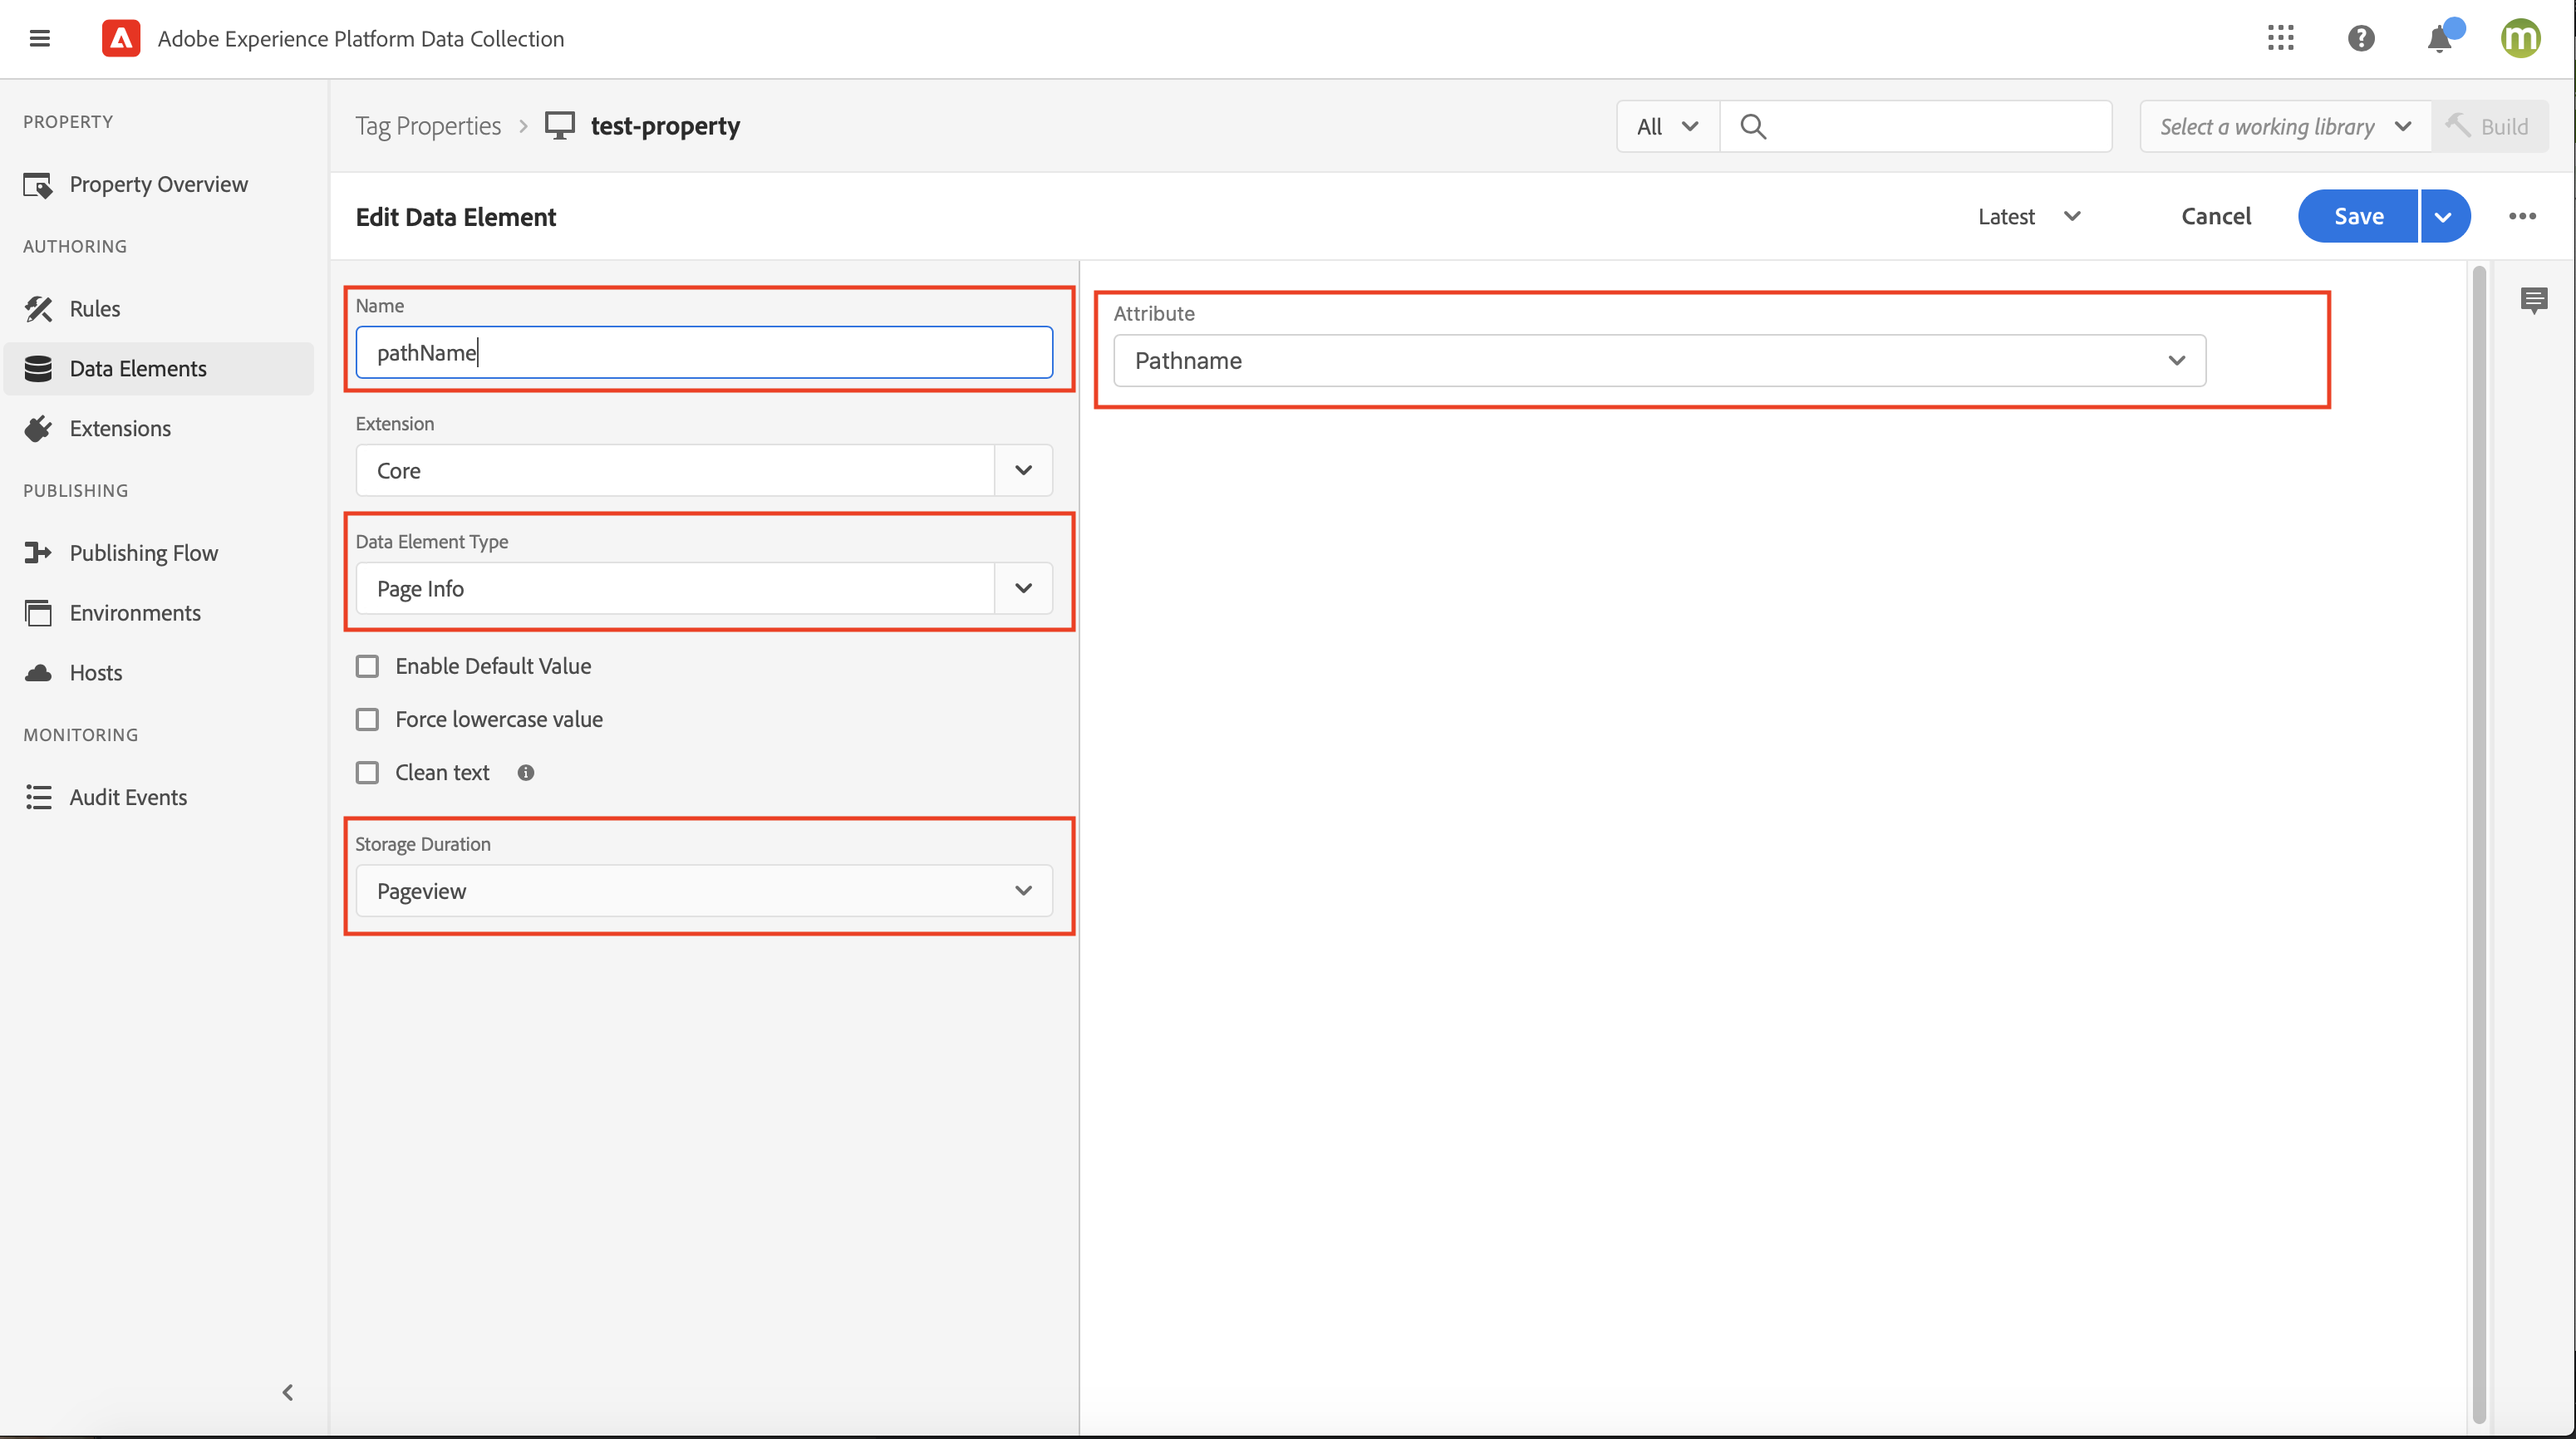
-
Edit your existing Rules to set up the
eVar2variable.In this example, we use a custom variable called eVar2,but you can use any custom variable available that suits your requirements.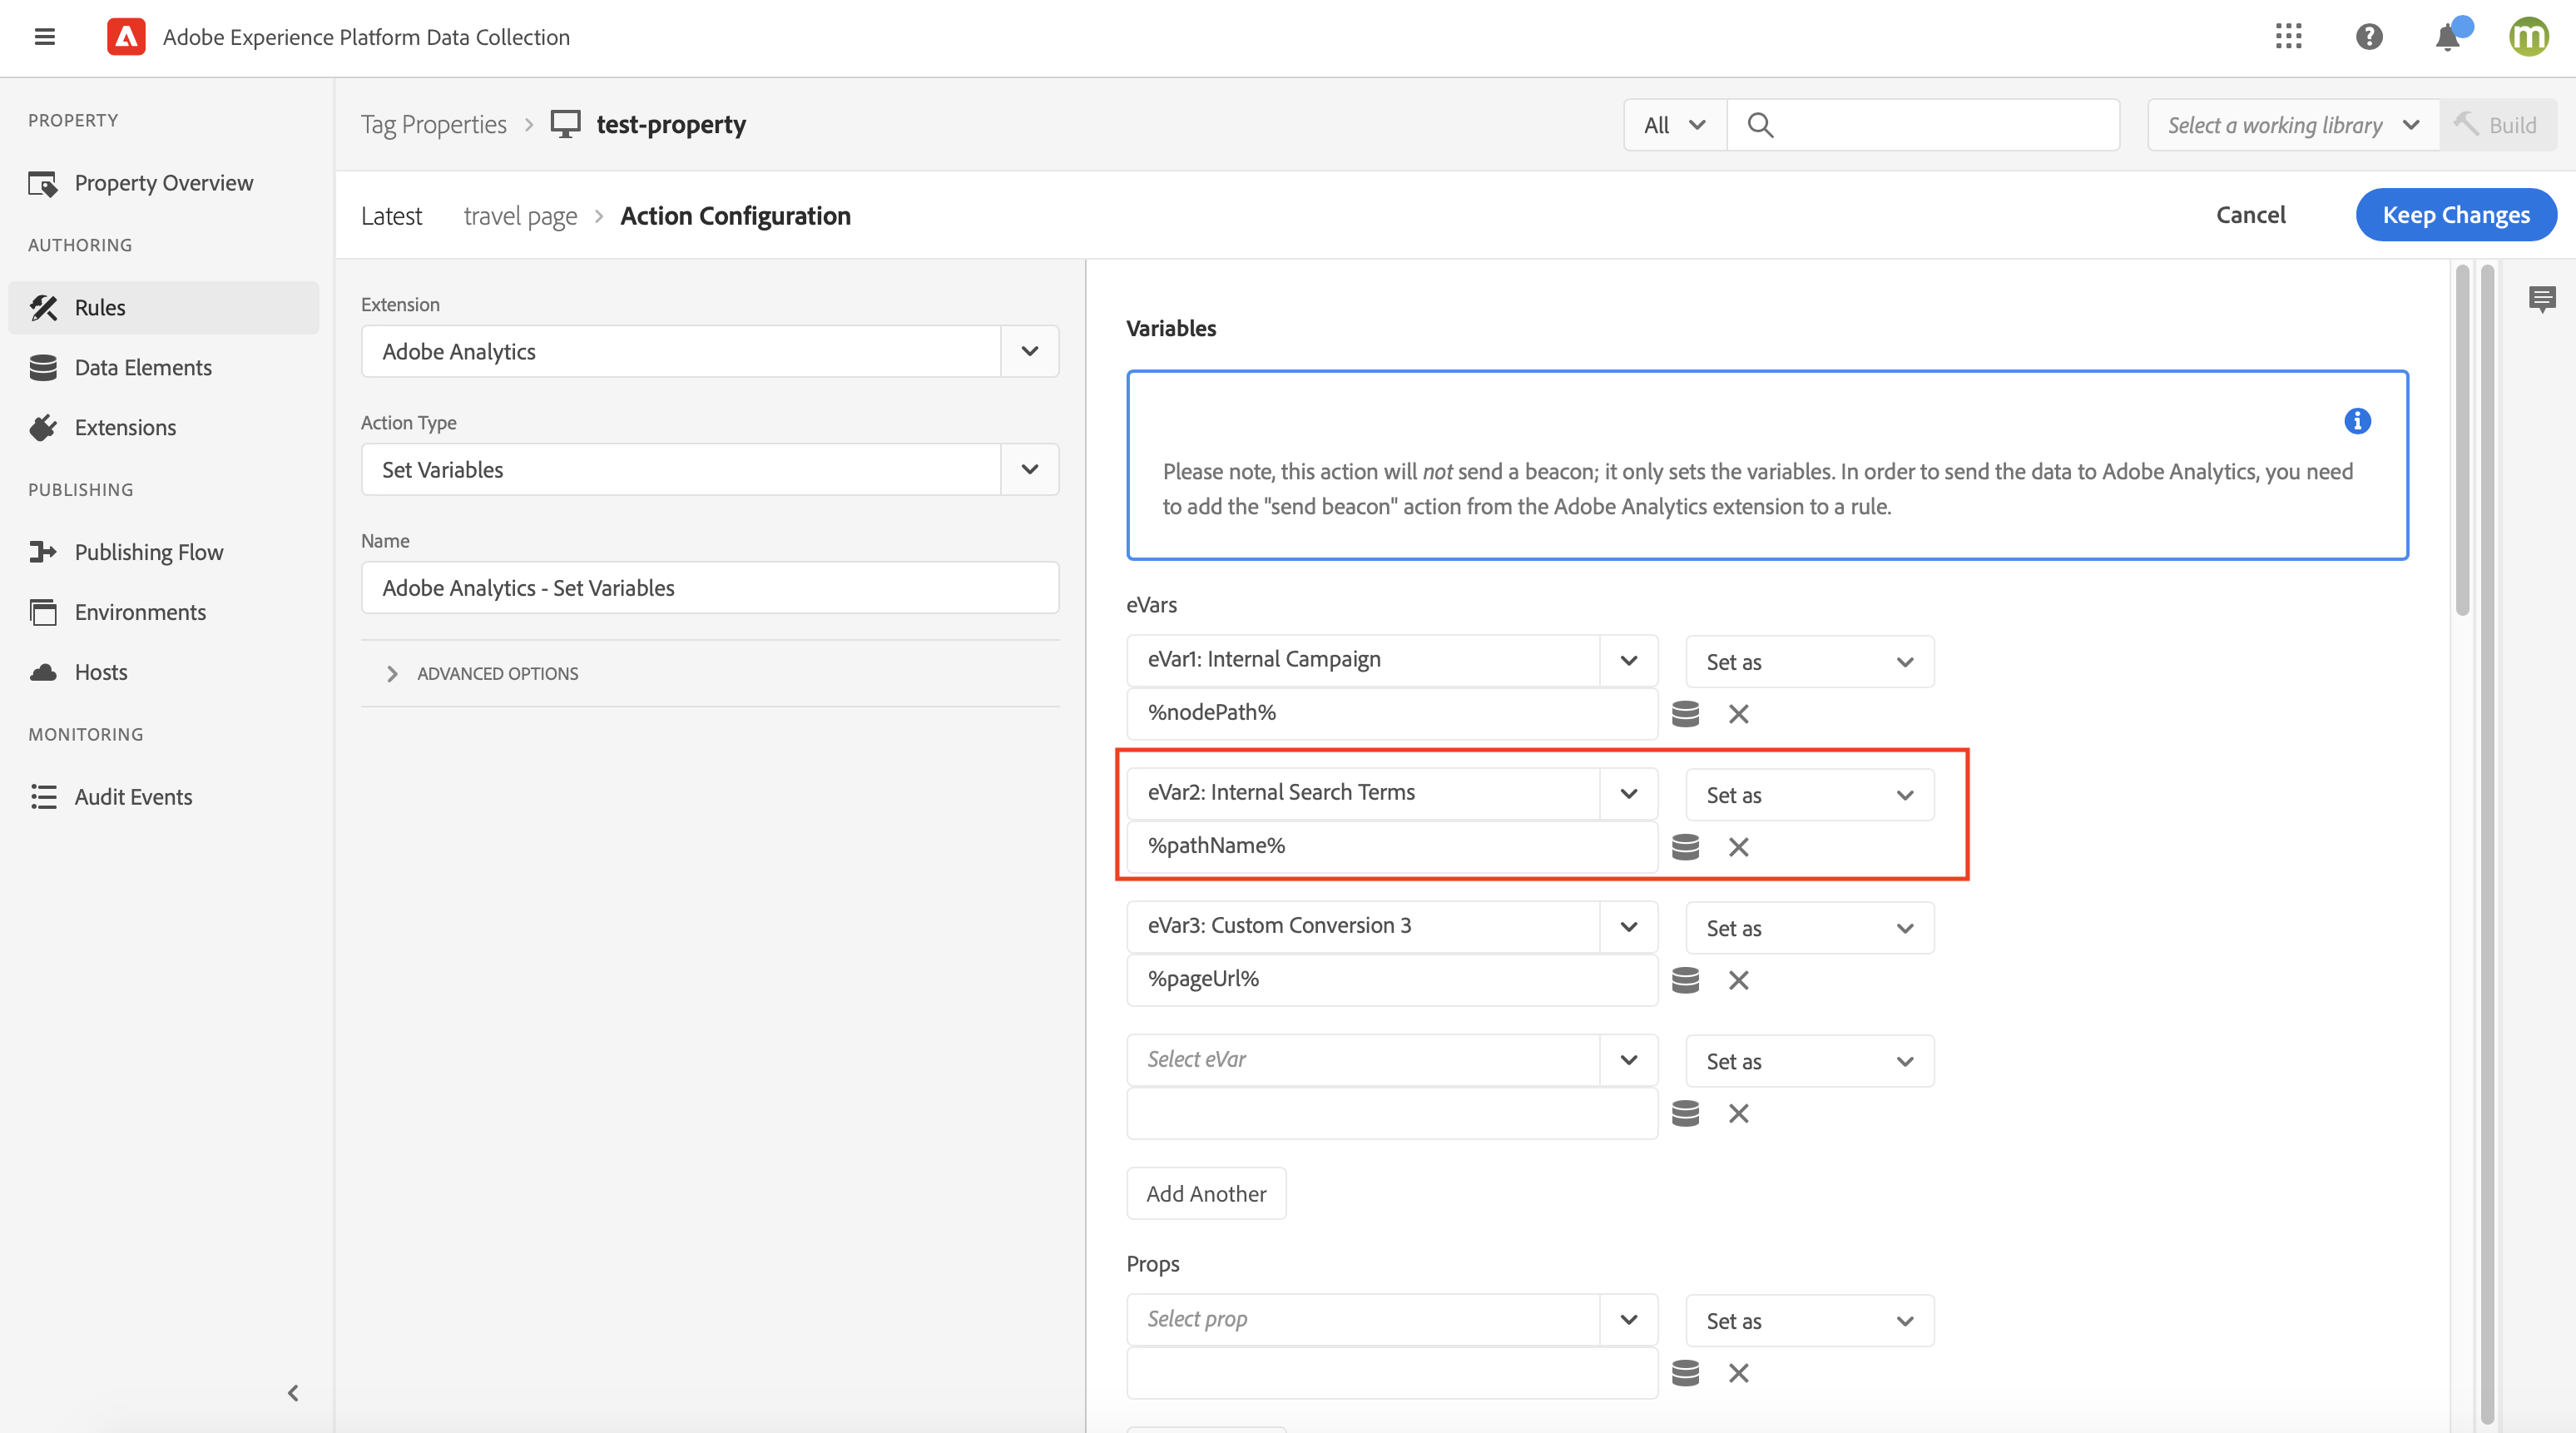
-
Ensure your script can send
eVar2by Adobe debugger
|
We recommend you try to fetch your report with Adobe Swagger first to ensure the custom variable Example JSON body request:
|
Configure your Magnolia Adobe Analytics IUX slot for the use cases above
In Magnolia, you then prepare the YAML configuration so that the Adobe connector datasupplier can get the breakdown report.
Make sure you configure the correct eVar dimension.
|
  extensionViews:
  - name: analytics
    icon: icon-analytics-app
    view:
      name: analytics
      $type: analyticsView
      chartDefinitions:
        - name: usecase1
          label: "Adobe Page Views With Metric Filters"
          class: info.magnolia.analytics.amcharts.data.AmChartDefinition
          dataSupplier: adobeMetricFilterDataSupplier
          chartType: !include:/analytics-ui/chartTypes/line-and-area/line-different-colors-ups-downs.yaml
            series:
              - name: series
                dataFields:
                  - name: categoryX
                    jsonPath: "$.rows[*].value"
                  - name: valueY
                    jsonPath: "$.rows[*].data[0]"
            xAxes: !override
              - name: xaxe
                renderer:
                  labels:
                    truncate: true
                    maxWidth: 90
        - name: usecase2
          label: "Total Adobe Page Views"
          class: info.magnolia.analytics.amcharts.data.AmChartDefinition
          dataSupplier: adobePageViewsDataSupplier
          chartType: !include:/analytics-ui/chartTypes/line-and-area/line-different-colors-ups-downs.yaml
            series:
              - name: series
                dataFields:
                  - name: categoryX
                    jsonPath: "$.rows[*].value"
                  - name: valueY
                    jsonPath: "$.rows[*].data[0]"
            xAxes: !override
              - name: xaxe
                renderer:
                  labels:
                    truncate: true
                    maxWidth: 90 #maxWidth can be changed depending on to your config, exp: 120 instead of 90
      dataSuppliers:
        adobeMetricFilterDataSupplier:
          class: info.magnolia.analytics.adobe.datasource.AdobeDataSupplier
          credentials:
            parameters:
              serviceUrl: https://analytics.adobe.io/api/xxxxxxxxxxxx/reports
              clientId: <your-client-id>
              clientSecret: <client_secret_or_path_to_password_manager>
              companyId: <your-company-id>
              orgId: xxxxxxx@AdobeOrg
              technicalAccountId: xxxxxx@techacct.adobe.com
              imsHost: https://ims-na1.adobelogin.com
              imsExchange: https://ims-na1.adobelogin.com/ims/exchange/jwt
              privateKeyPath: /bca-common/adobe/secret.key
              metascopes: ent_analytics_bulk_ingest_sdk
              tokenExpTime: 3600
          parameters:
            rsid: xxxxxxxx
            gFilterType: dateRange
            metricId: metrics/pageviews
            dimension: variables/daterangeday
          metricFiltersExpression:
            - id: 0
              type: breakdown
              dimension: variables/evar1 #This is just an example, the variable needs to be configured to map with pageName or pageUrl
              itemValue: "%s" # %s is selected node path. Ex: /travel
        adobePageViewsDataSupplier:
          class: info.magnolia.analytics.adobe.datasource.AdobeDataSupplier
          credentials:
            parameters:
              serviceUrl: https://analytics.adobe.io/api/xxxxxxxxxxxx/reports
              clientId: xxxxxxxx
              clientSecret: /AdobeAnalytics/ClientSecret
              companyId: xxxxxxx
              orgId: xxxxxxx@AdobeOrg
              technicalAccountId: xxxxxx@techacct.adobe.com
              imsHost: https://ims-na1.adobelogin.com
              imsExchange: https://ims-na1.adobelogin.com/ims/exchange/jwt
              privateKeyPath: /bca-common/adobe/secret.key
              metascopes: ent_analytics_bulk_ingest_sdk
              tokenExpTime: 3600
          parameters:
            rsid: xxxxxxxx
            gFilterType: dateRange
            metricId: metrics/pageviews
            dimension: variables/evar2
          filteringSubSetExpression:
            clause: CONTAINS '%s' #selected node path
      filterFields:
        - name: startDate
          $type: dateField
        - name: endDate
          $type: dateField